
Auto insurance provider Mercury General (NYSE: MCY) beat Wall Street’s revenue expectations in Q3 CY2025, with sales up 4.9% year on year to $1.58 billion. Its GAAP profit of $5.06 per share was significantly above analysts’ consensus estimates.
Is now the time to buy Mercury General? Find out by accessing our full research report, it’s free for active Edge members.
Mercury General (MCY) Q3 CY2025 Highlights:
Company Overview
Founded in 1961 and maintaining a network of over 6,300 independent agents across the country, Mercury General (NYSE: MCY) is an insurance company that primarily sells automobile insurance policies through independent agents in 11 states, with a strong focus on California.
Revenue Growth
Big picture, insurers generate revenue from three key sources. The first is the core business of underwriting policies. The second source is income from investing the “float” (premiums collected upfront not yet paid out as claims) in assets such as fixed-income assets and equities. The third is fees from various sources such as policy administration, annuities, or other value-added services. Thankfully, Mercury General’s 10.4% annualized revenue growth over the last five years was solid. Its growth beat the average insurance company and shows its offerings resonate with customers.
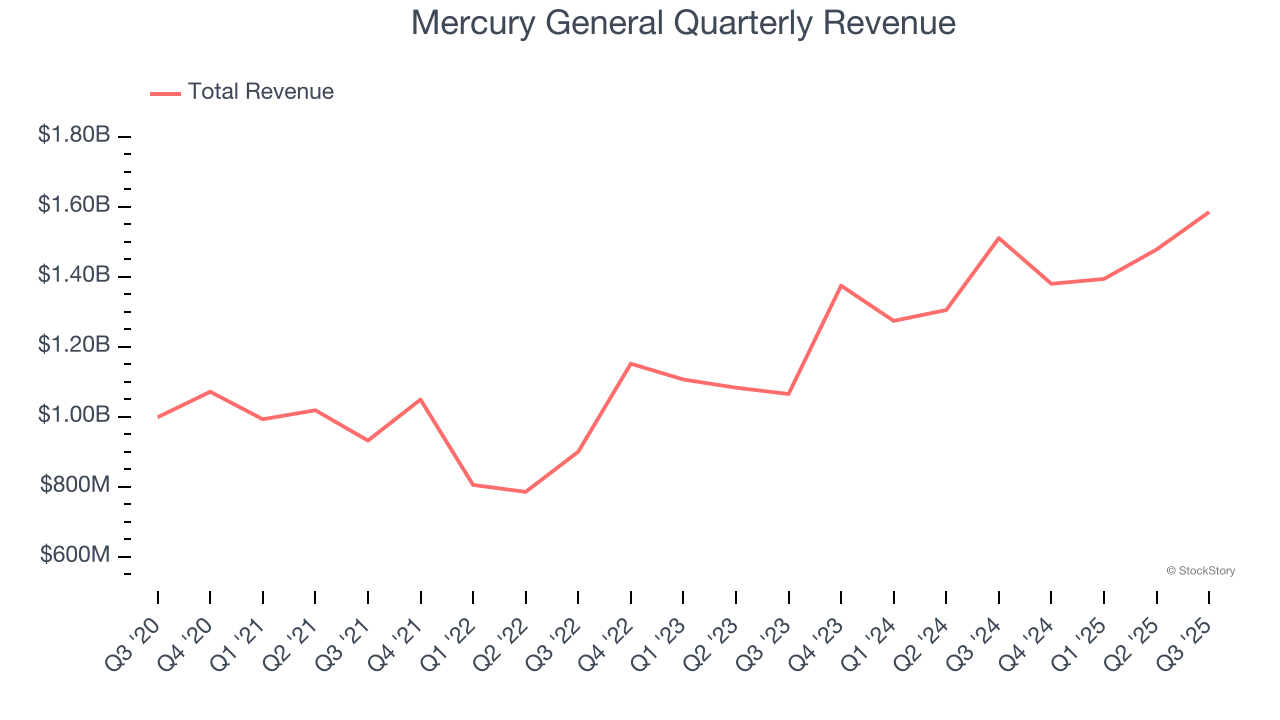
Long-term growth is the most important, but within financials, a half-decade historical view may miss recent interest rate changes and market returns. Mercury General’s annualized revenue growth of 15.1% over the last two years is above its five-year trend, suggesting its demand was strong and recently accelerated. 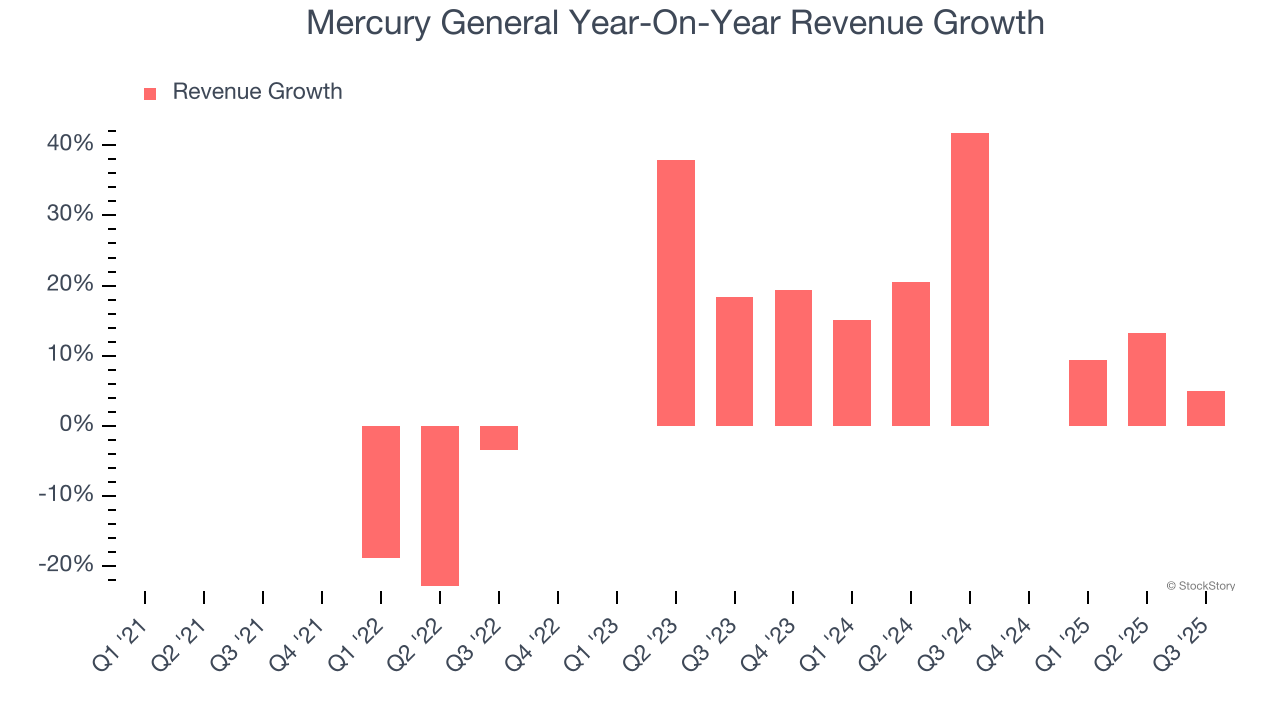 Note: Quarters not shown were determined to be outliers, impacted by outsized investment gains/losses that are not indicative of the recurring fundamentals of the business.
This quarter, Mercury General reported modest year-on-year revenue growth of 4.9% but beat Wall Street’s estimates by 6.7%.
Net premiums earned made up 94.7% of the company’s total revenue during the last five years, meaning Mercury General lives and dies by its underwriting activities because non-insurance operations barely move the needle.
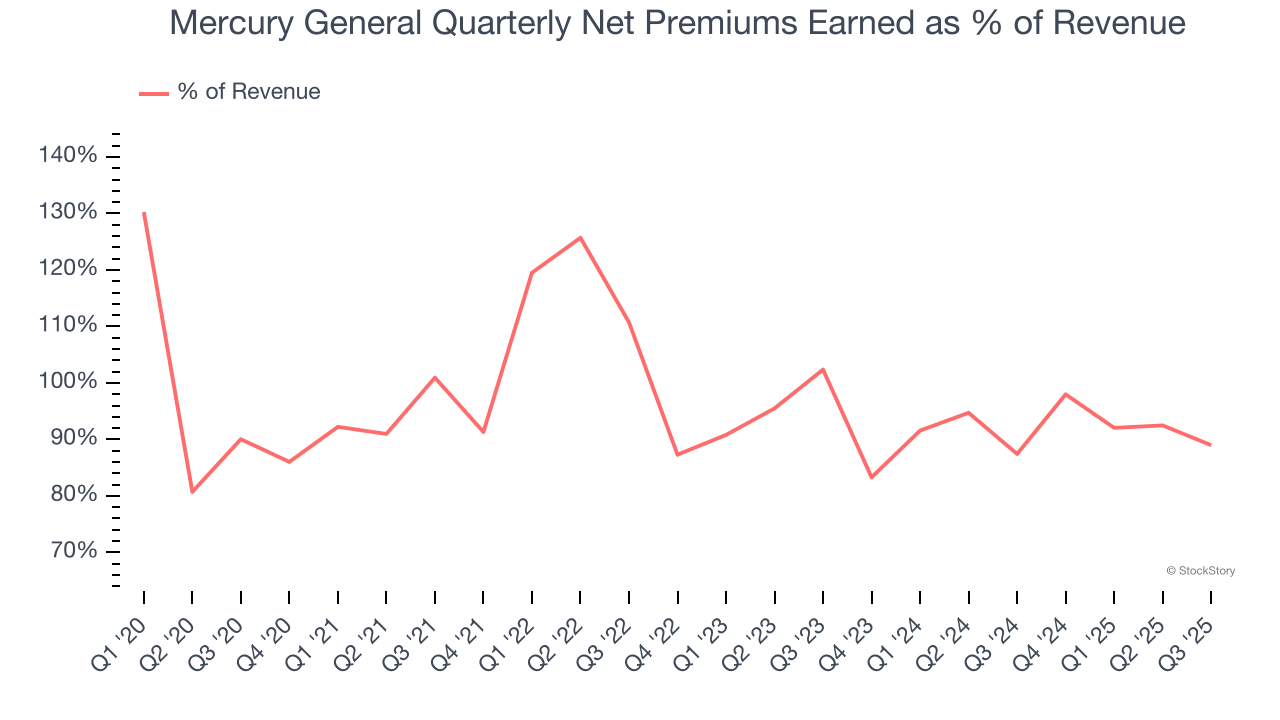
Our experience and research show the market cares primarily about an insurer’s net premiums earned growth as investment and fee income are considered more susceptible to market volatility and economic cycles.
The 1999 book Gorilla Game predicted Microsoft and Apple would dominate tech before it happened. Its thesis? Identify the platform winners early. Today, enterprise software companies embedding generative AI are becoming the new gorillas. a profitable, fast-growing enterprise software stock that is already riding the automation wave and looking to catch the generative AI next.
Book Value Per Share (BVPS)
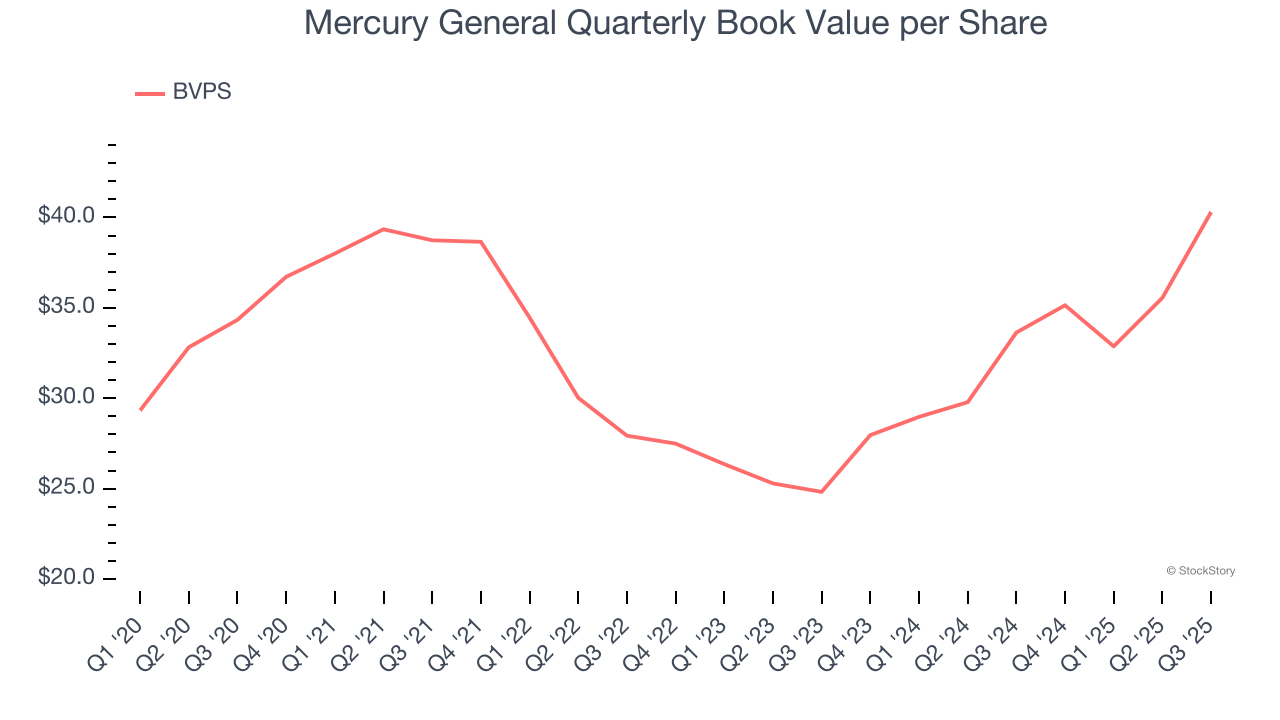
Insurance companies are balance sheet businesses, collecting premiums upfront and paying out claims over time. The float – premiums collected but not yet paid out – are invested, creating an asset base supported by a liability structure. Book value captures this dynamic by measuring:
- Assets (investment portfolio, cash, reinsurance recoverables) - liabilities (claim reserves, debt, future policy benefits)
BVPS is essentially the residual value for shareholders.
We therefore consider BVPS very important to track for insurers and a metric that sheds light on business quality. While other (and more commonly known) per-share metrics like EPS can sometimes be lumpy due to reserve releases or one-time items and can be managed or skewed while still following accounting rules, BVPS reflects long-term capital growth and is harder to manipulate.
Mercury General’s BVPS grew at a sluggish 3.3% annual clip over the last five years. However, BVPS growth has accelerated recently, growing by 27.4% annually over the last two years from $24.82 to $40.30 per share.
Key Takeaways from Mercury General’s Q3 Results
It was good to see Mercury General beat analysts’ EPS expectations this quarter. We were also excited its revenue outperformed Wall Street’s estimates by a wide margin. Zooming out, we think this was a solid print. Investors were likely hoping for more, and shares traded down 2.3% to $78.04 immediately following the results.
So should you invest in Mercury General right now? What happened in the latest quarter matters, but not as much as longer-term business quality and valuation, when deciding whether to invest in this stock. We cover that in our actionable full research report which you can read here, it’s free for active Edge members.


