
Beer company Molson Coors (NYSE: TAP) missed Wall Street’s revenue expectations in Q3 CY2025, with sales falling 2.3% year on year to $2.97 billion. Its GAAP loss of $14.79 per share decreased from $0.96 in the same quarter last year.
Is now the time to buy Molson Coors? Find out by accessing our full research report, it’s free for active Edge members.
Molson Coors (TAP) Q3 CY2025 Highlights:
- Revenue: $2.97 billion vs analyst estimates of $3.02 billion (2.3% year-on-year decline, 1.4% miss)
- Adjusted EBITDA: $665.4 million vs analyst estimates of $653.2 million (22.4% margin, 1.9% beat)
- Operating Margin: -115%, down from 14.8% in the same quarter last year
- Free Cash Flow Margin: 16.2%, up from 11.7% in the same quarter last year
- Sales Volumes fell 6% year on year (-12.3% in the same quarter last year)
- Market Capitalization: $8.55 billion
Company Overview
Sporting an impressive roster of iconic beer brands, Molson Coors (NYSE: TAP) is a global brewing giant with a rich history dating back more than two centuries.
Revenue Growth
Reviewing a company’s long-term sales performance reveals insights into its quality. Any business can put up a good quarter or two, but the best consistently grow over the long haul.
With $11.21 billion in revenue over the past 12 months, Molson Coors is one of the larger consumer staples companies and benefits from a well-known brand that influences purchasing decisions. However, its scale is a double-edged sword because it’s harder to find incremental growth when your existing brands have penetrated most of the market. To accelerate sales, Molson Coors likely needs to optimize its pricing or lean into new products and international expansion.
As you can see below, Molson Coors grew its sales at a sluggish 1.6% compounded annual growth rate over the last three years as consumers bought less of its products. We’ll explore what this means in the "Volume Growth" section.
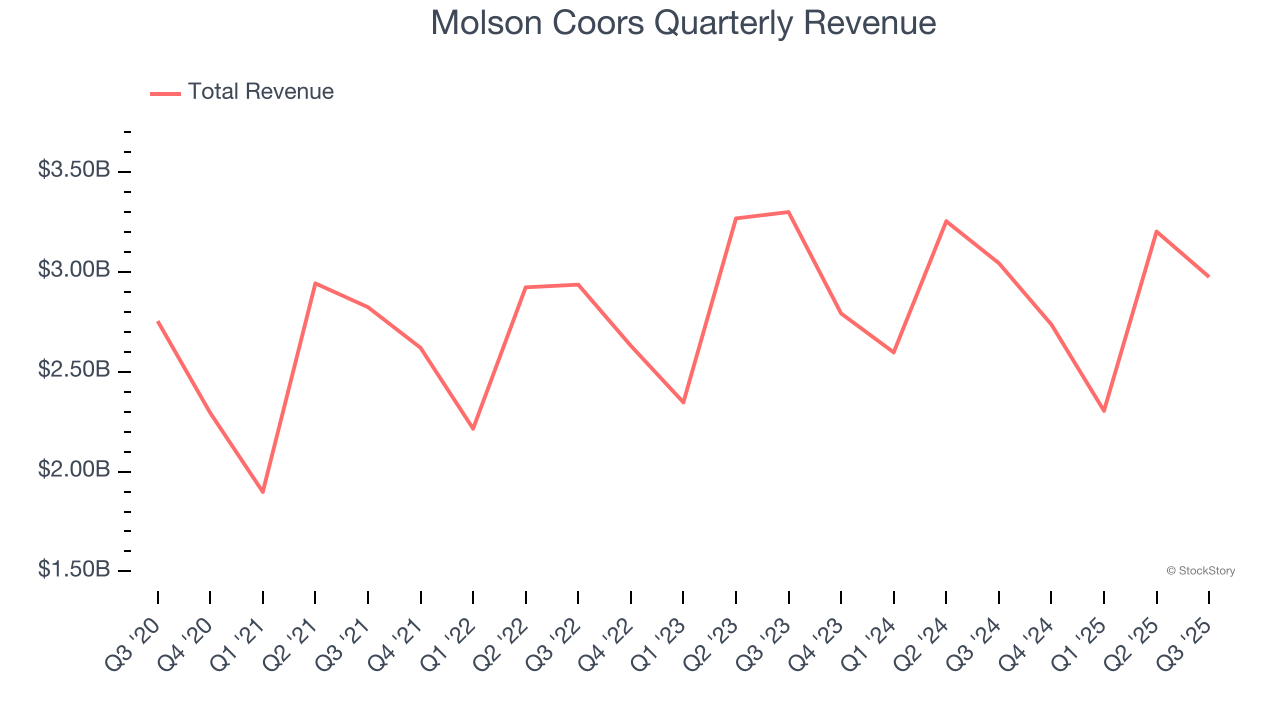
This quarter, Molson Coors missed Wall Street’s estimates and reported a rather uninspiring 2.3% year-on-year revenue decline, generating $2.97 billion of revenue.
Looking ahead, sell-side analysts expect revenue to remain flat over the next 12 months. This projection is underwhelming and suggests its newer products will not lead to better top-line performance yet.
While Wall Street chases Nvidia at all-time highs, an under-the-radar semiconductor supplier is dominating a critical AI component these giants can’t build without. Click here to access our free report one of our favorites growth stories.
Volume Growth
Revenue growth can be broken down into changes in price and volume (the number of units sold). While both are important, volume is the lifeblood of a successful staples business as there’s a ceiling to what consumers will pay for everyday goods; they can always trade down to non-branded products if the branded versions are too expensive.
Molson Coors’s average quarterly sales volumes have shrunk by 5.6% over the last two years. This decrease isn’t ideal because the quantity demanded for consumer staples products is typically stable. 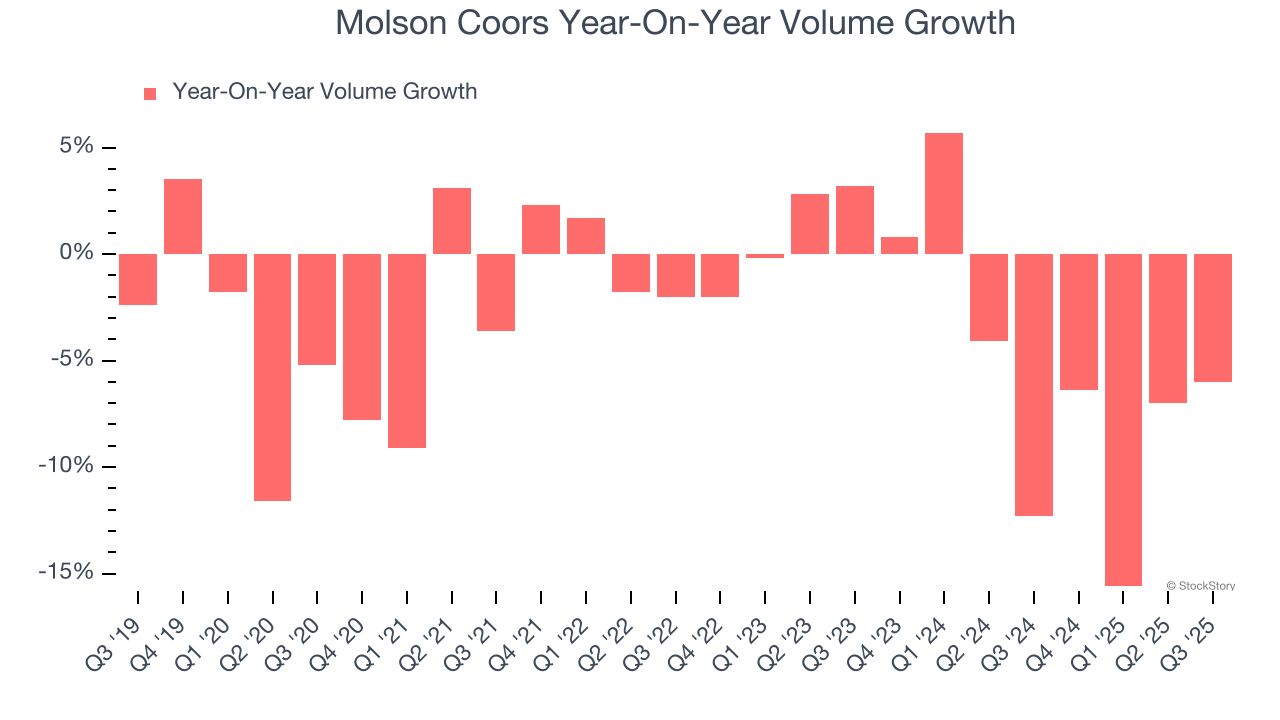
In Molson Coors’s Q3 2025, sales volumes dropped 6% year on year. This result represents a further deceleration from its historical levels, showing the business is struggling to move its products.
Key Takeaways from Molson Coors’s Q3 Results
It was encouraging to see Molson Coors beat analysts’ gross margin expectations this quarter. We were also happy its EBITDA outperformed Wall Street’s estimates. On the other hand, its revenue slightly missed. Overall, this was a weaker quarter. The stock remained flat at $43.09 immediately following the results.
Big picture, is Molson Coors a buy here and now? If you’re making that decision, you should consider the bigger picture of valuation, business qualities, as well as the latest earnings. We cover that in our actionable full research report which you can read here, it’s free for active Edge members.


