
Bedding and comfort retailer Purple (NASDAQ: PRPL) fell short of the markets revenue expectations in Q3 CY2025, with sales flat year on year at $118.8 million. On the other hand, the company’s full-year revenue guidance of $475 million at the midpoint came in 0.6% above analysts’ estimates. Its non-GAAP loss of $0.08 per share was 17.9% above analysts’ consensus estimates.
Is now the time to buy Purple? Find out by accessing our full research report, it’s free for active Edge members.
Purple (PRPL) Q3 CY2025 Highlights:
- Revenue: $118.8 million vs analyst estimates of $123.2 million (flat year on year, 3.6% miss)
- Adjusted EPS: -$0.08 vs analyst estimates of -$0.10 (17.9% beat)
- Adjusted EBITDA: $189,000 vs analyst estimates of -$42,500 (0.2% margin, relatively in line)
- The company reconfirmed its revenue guidance for the full year of $475 million at the midpoint
- Operating Margin: -10.2%, up from -39.5% in the same quarter last year
- Market Capitalization: $86.28 million
"Our third quarter results reflect the continued progress we're making in strengthening Purple's foundation and positioning the company for sustainable, profitable growth," said Rob DeMartini, CEO of Purple Innovation.
Company Overview
Founded by two brothers, Purple (NASDAQ: PRPL) creates sleep and home comfort products such as mattresses, pillows, and bedding accessories.
Revenue Growth
Examining a company’s long-term performance can provide clues about its quality. Any business can put up a good quarter or two, but many enduring ones grow for years. Over the last five years, Purple’s demand was weak and its revenue declined by 5.3% per year. This wasn’t a great result and is a sign of poor business quality.
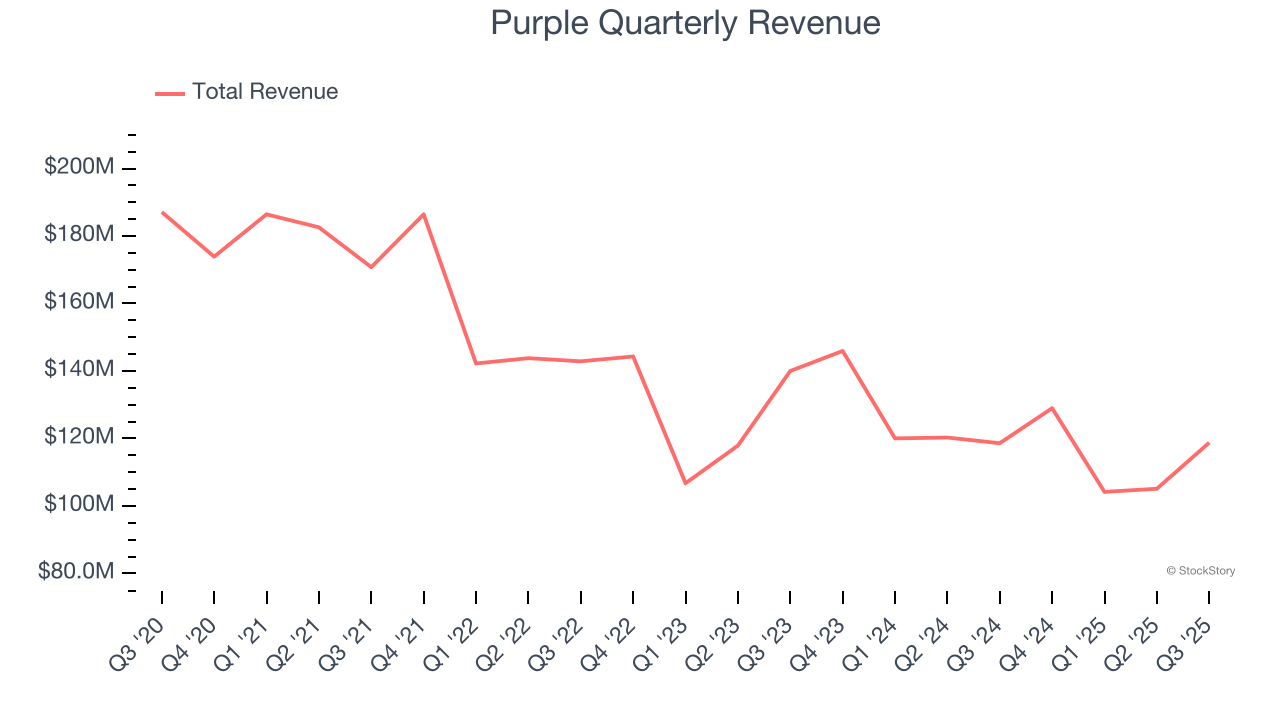
Long-term growth is the most important, but within consumer discretionary, product cycles are short and revenue can be hit-driven due to rapidly changing trends and consumer preferences. Purple’s annualized revenue declines of 5.2% over the last two years align with its five-year trend, suggesting its demand has consistently shrunk. 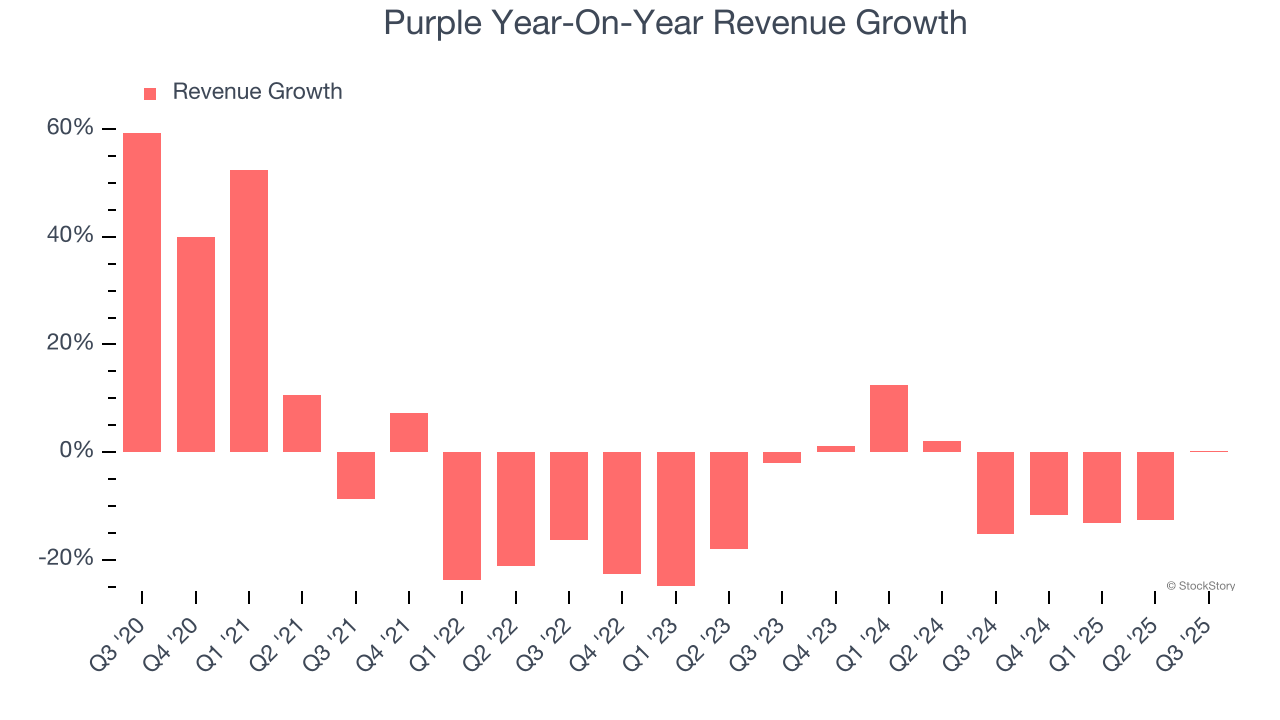
This quarter, Purple’s $118.8 million of revenue was flat year on year, falling short of Wall Street’s estimates.
Looking ahead, sell-side analysts expect revenue to grow 15% over the next 12 months, an improvement versus the last two years. This projection is admirable and suggests its newer products and services will catalyze better top-line performance.
The 1999 book Gorilla Game predicted Microsoft and Apple would dominate tech before it happened. Its thesis? Identify the platform winners early. Today, enterprise software companies embedding generative AI are becoming the new gorillas. a profitable, fast-growing enterprise software stock that is already riding the automation wave and looking to catch the generative AI next.
Operating Margin
Operating margin is an important measure of profitability as it shows the portion of revenue left after accounting for all core expenses – everything from the cost of goods sold to advertising and wages. It’s also useful for comparing profitability across companies with different levels of debt and tax rates because it excludes interest and taxes.
Purple’s operating margin has risen over the last 12 months, but it still averaged negative 15.5% over the last two years. This is due to its large expense base and inefficient cost structure.
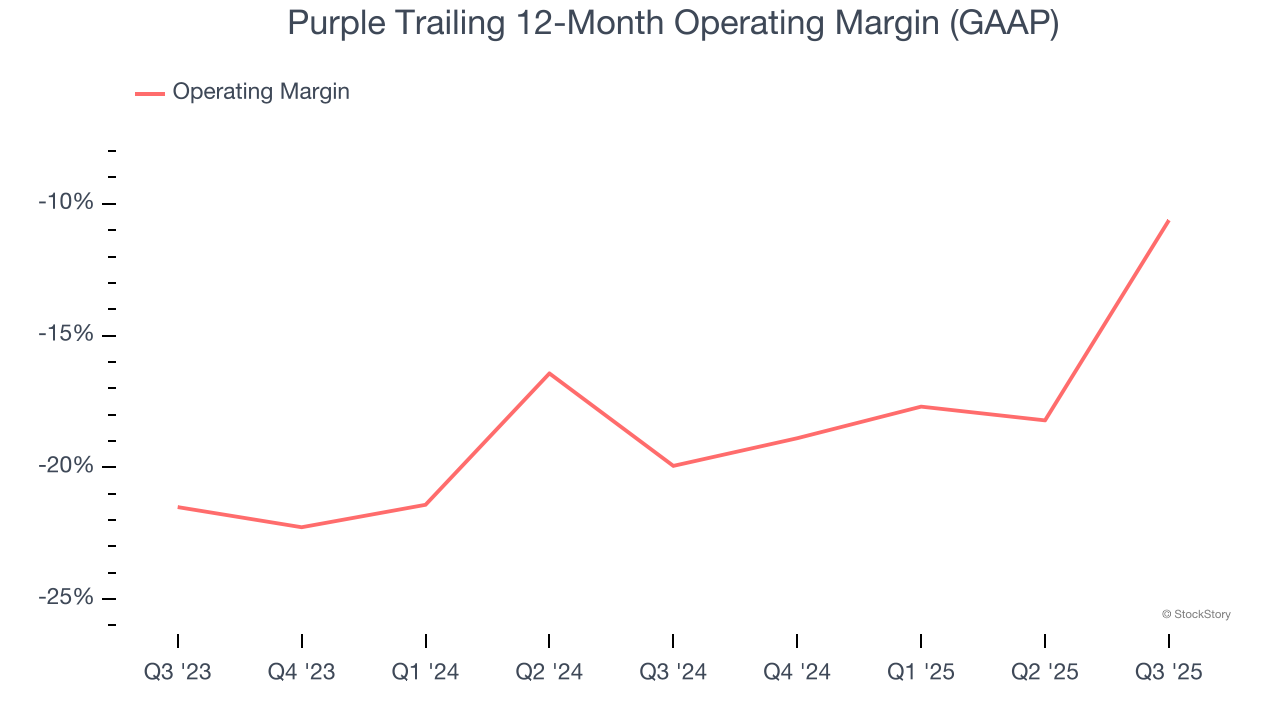
Purple’s operating margin was negative 10.2% this quarter. The company's consistent lack of profits raise a flag.
Earnings Per Share
Revenue trends explain a company’s historical growth, but the long-term change in earnings per share (EPS) points to the profitability of that growth – for example, a company could inflate its sales through excessive spending on advertising and promotions.
Sadly for Purple, its EPS declined by 19.9% annually over the last five years, more than its revenue. This tells us the company struggled because its fixed cost base made it difficult to adjust to shrinking demand.
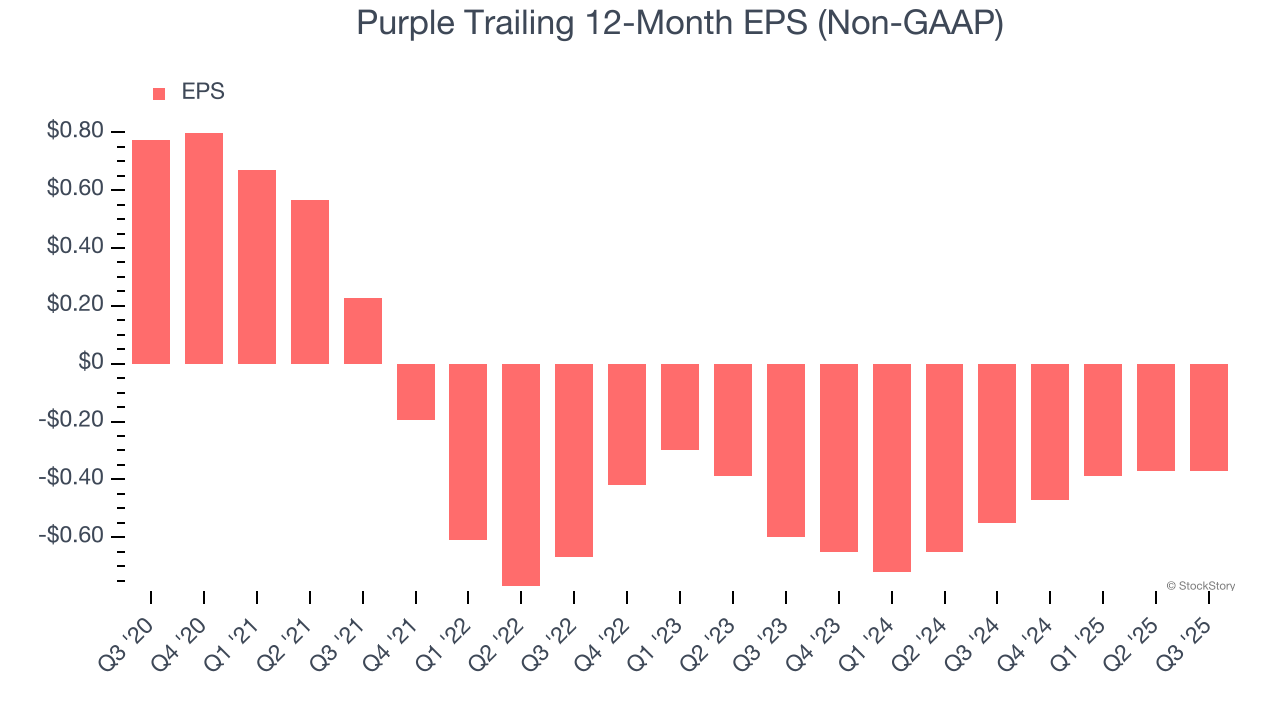
In Q3, Purple reported adjusted EPS of negative $0.08, in line with the same quarter last year. This print easily cleared analysts’ estimates, and shareholders should be content with the results. Over the next 12 months, Wall Street expects Purple to improve its earnings losses. Analysts forecast its full-year EPS of negative $0.37 will advance to negative $0.20.
Key Takeaways from Purple’s Q3 Results
We were impressed by how significantly Purple blew past analysts’ EPS expectations this quarter. On the other hand, its revenue missed. Overall, this print had some key positives. Investors were likely hoping for more, and shares traded down 5% to $0.76 immediately following the results.
Is Purple an attractive investment opportunity at the current price? If you’re making that decision, you should consider the bigger picture of valuation, business qualities, as well as the latest earnings. We cover that in our actionable full research report which you can read here, it’s free for active Edge members.