Cybersecurity cloud platform provider Qualys (NASDAQ: QLYS) reported revenue ahead of Wall Streets expectations in Q3 CY2025, with sales up 10.4% year on year to $169.9 million. Guidance for next quarter’s revenue was optimistic at $173 million at the midpoint, 2.1% above analysts’ estimates. Its non-GAAP profit of $1.86 per share was 19.2% above analysts’ consensus estimates.
Is now the time to buy Qualys? Find out by accessing our full research report, it’s free for active Edge members.
Qualys (QLYS) Q3 CY2025 Highlights:
- Revenue: $169.9 million vs analyst estimates of $166.3 million (10.4% year-on-year growth, 2.2% beat)
- Adjusted EPS: $1.86 vs analyst estimates of $1.56 (19.2% beat)
- Adjusted Operating Income: $80.04 million vs analyst estimates of $65.64 million (47.1% margin, 21.9% beat)
- Revenue Guidance for Q4 CY2025 is $173 million at the midpoint, above analyst estimates of $169.5 million
- Management raised its full-year Adjusted EPS guidance to $6.97 at the midpoint, a 9.7% increase
- Operating Margin: 35.3%, up from 29.2% in the same quarter last year
- Free Cash Flow Margin: 135%, up from 19.8% in the previous quarter
- Billings: $186.4 million at quarter end, up 15.3% year on year
- Market Capitalization: $4.52 billion
"In Q3, we continued to execute well, demonstrated by another quarter of solid revenue growth and profitability," said Sumedh Thakar, Qualys' president and CEO.
Company Overview
Originally developed to address the growing complexity of IT security in the cloud era, Qualys (NASDAQ: QLYS) provides a cloud-based platform that helps organizations identify, manage, and protect their IT assets from cyber threats across on-premises, cloud, and mobile environments.
Revenue Growth
A company’s long-term performance is an indicator of its overall quality. Any business can put up a good quarter or two, but many enduring ones grow for years. Over the last five years, Qualys grew its sales at a 13.1% compounded annual growth rate. Although this growth is acceptable on an absolute basis, it fell short of our standards for the software sector, which enjoys a number of secular tailwinds.
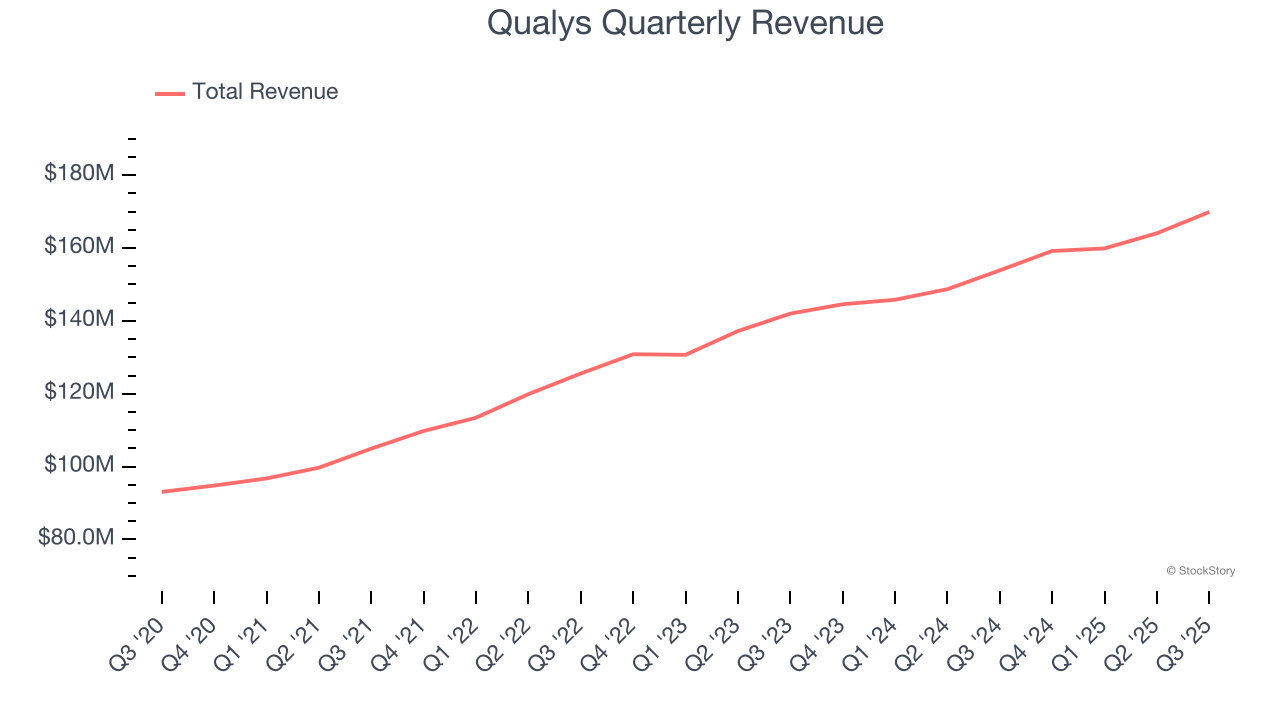
We at StockStory place the most emphasis on long-term growth, but within software, a half-decade historical view may miss recent innovations or disruptive industry trends. Qualys’s recent performance shows its demand has slowed as its annualized revenue growth of 9.9% over the last two years was below its five-year trend. 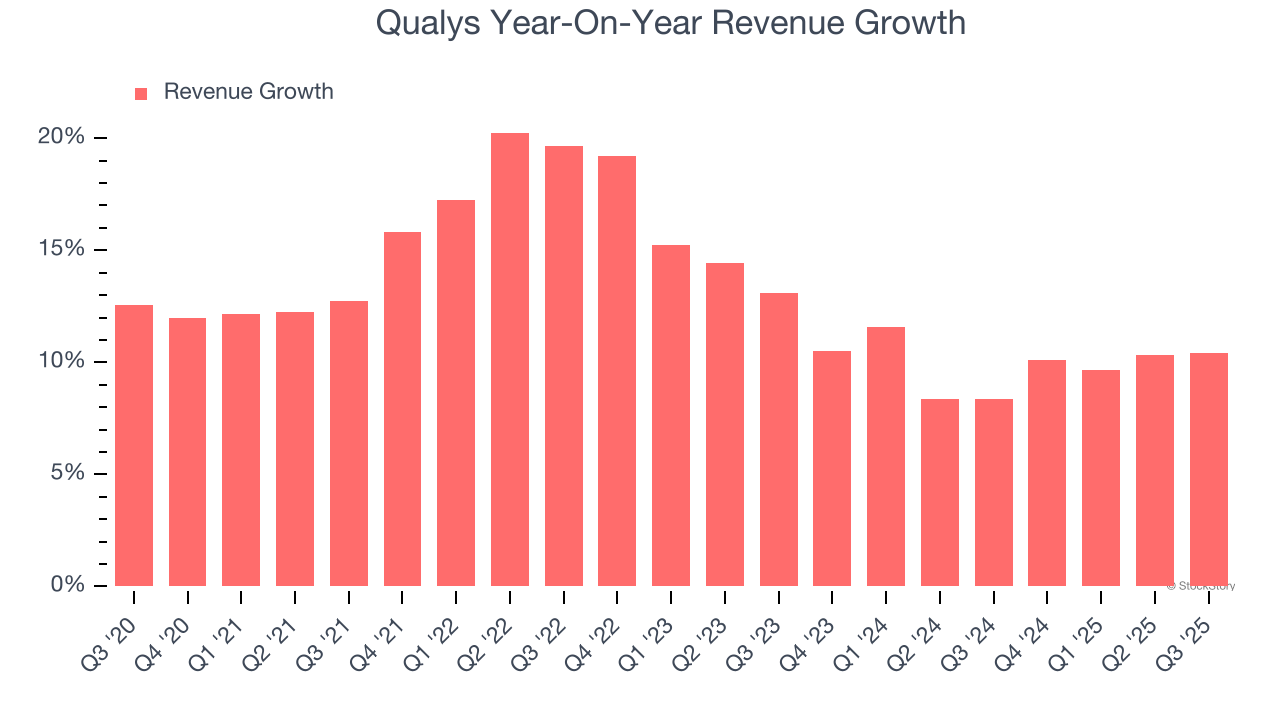
This quarter, Qualys reported year-on-year revenue growth of 10.4%, and its $169.9 million of revenue exceeded Wall Street’s estimates by 2.2%. Company management is currently guiding for a 8.7% year-on-year increase in sales next quarter.
Looking further ahead, sell-side analysts expect revenue to grow 5.9% over the next 12 months, a deceleration versus the last two years. This projection is underwhelming and implies its products and services will see some demand headwinds.
Microsoft, Alphabet, Coca-Cola, Monster Beverage—all began as under-the-radar growth stories riding a massive trend. We’ve identified the next one: a profitable AI semiconductor play Wall Street is still overlooking. Go here for access to our full report.
Billings
Billings is a non-GAAP metric that is often called “cash revenue” because it shows how much money the company has collected from customers in a certain period. This is different from revenue, which must be recognized in pieces over the length of a contract.
Qualys’s billings came in at $186.4 million in Q3, and over the last four quarters, its growth was underwhelming as it averaged 10.8% year-on-year increases. This performance mirrored its total sales and suggests that increasing competition is causing challenges in acquiring/retaining customers. 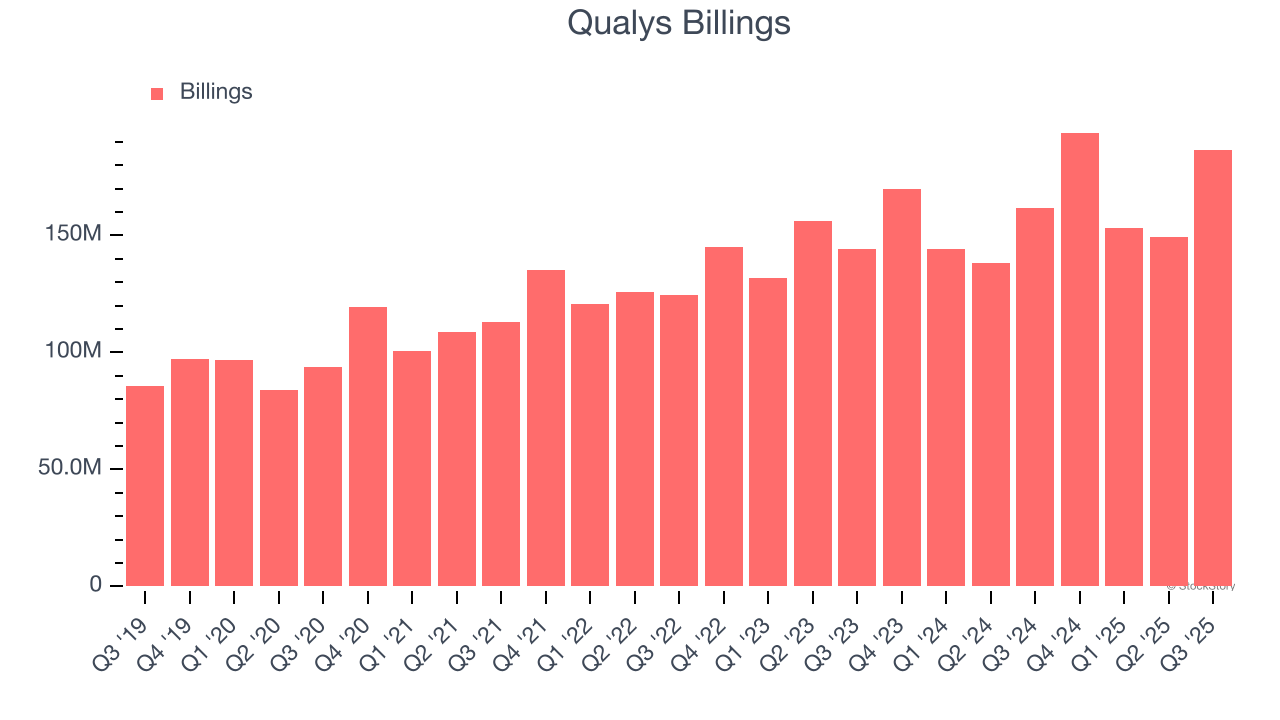
Customer Acquisition Efficiency
The customer acquisition cost (CAC) payback period measures the months a company needs to recoup the money spent on acquiring a new customer. This metric helps assess how quickly a business can break even on its sales and marketing investments.
It’s relatively expensive for Qualys to acquire new customers as its CAC payback period checked in at 62.3 months this quarter. The company’s slow recovery of its sales and marketing expenses indicates it operates in a highly competitive market and must invest to stand out, even if the return on that investment is low.
Key Takeaways from Qualys’s Q3 Results
We were impressed by how significantly Qualys blew past analysts’ billings expectations this quarter. We were also glad its EPS guidance for next quarter trumped Wall Street’s estimates. Zooming out, we think this quarter featured some important positives. The stock traded up 7.3% to $130 immediately after reporting.
Qualys may have had a good quarter, but does that mean you should invest right now? When making that decision, it’s important to consider its valuation, business qualities, as well as what has happened in the latest quarter. We cover that in our actionable full research report which you can read here, it’s free for active Edge members.


