
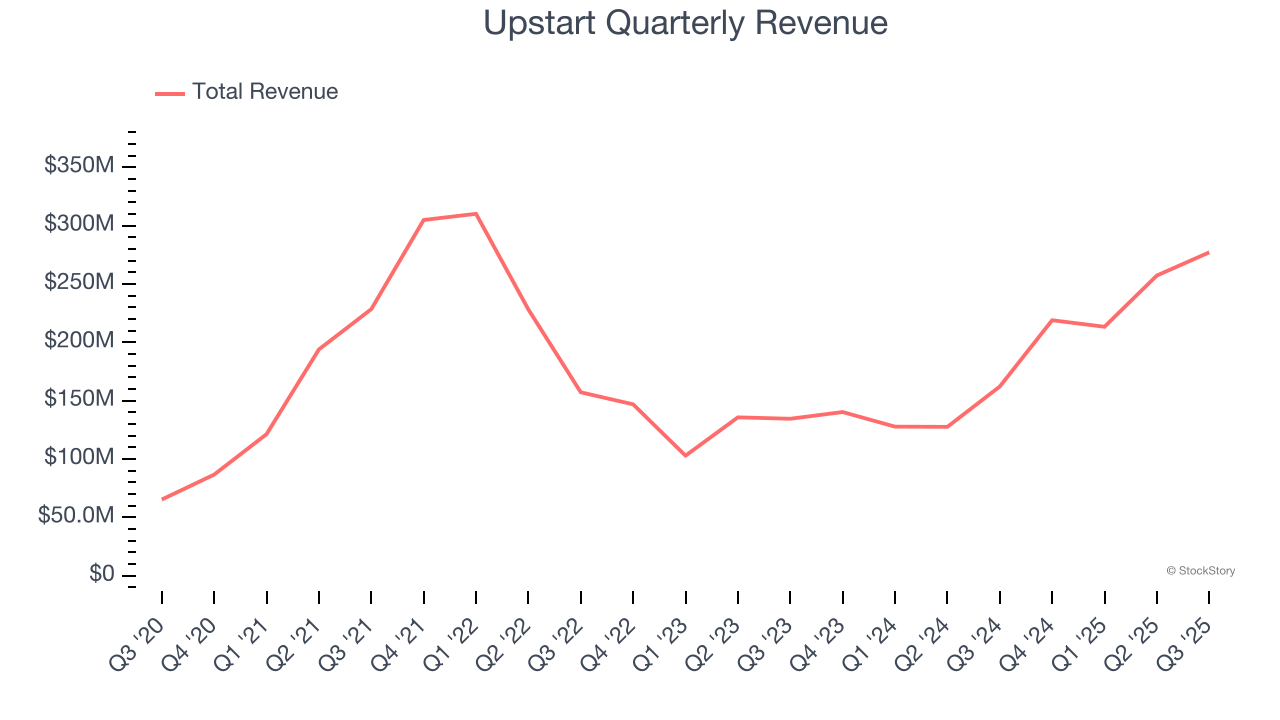
AI lending platform Upstart (NASDAQ: UPST) fell short of the markets revenue expectations in Q3 CY2025, but sales rose 70.9% year on year to $277.1 million. Next quarter’s revenue guidance of $288 million underwhelmed, coming in 6.1% below analysts’ estimates. Its non-GAAP profit of $0.52 per share was 23.4% above analysts’ consensus estimates.
Is now the time to buy Upstart? Find out by accessing our full research report, it’s free for active Edge members.
Upstart (UPST) Q3 CY2025 Highlights:
- Revenue: $277.1 million vs analyst estimates of $280.6 million (70.9% year-on-year growth, 1.3% miss)
- Adjusted EPS: $0.52 vs analyst estimates of $0.42 (23.4% beat)
- Adjusted EBITDA: $71.16 million vs analyst estimates of $56.04 million (25.7% margin, 27% beat)
- Revenue Guidance for Q4 CY2025 is $288 million at the midpoint, below analyst estimates of $306.6 million
- EBITDA guidance for Q4 CY2025 is $63 million at the midpoint, below analyst estimates of $67.43 million
- Operating Margin: 8.5%, up from -27.8% in the same quarter last year
- Free Cash Flow was -$126.6 million compared to -$140 million in the previous quarter
- Market Capitalization: $4.57 billion
Company Overview
Using over 2,500 data variables and trained on nearly 82 million repayment events, Upstart (NASDAQ: UPST) is an AI-powered lending platform that uses machine learning to help banks and credit unions more accurately assess borrower risk for personal loans, auto loans, and home equity lines of credit.
Revenue Growth
Reviewing a company’s long-term sales performance reveals insights into its quality. Any business can have short-term success, but a top-tier one grows for years. Over the last five years, Upstart grew its sales at an exceptional 35.8% compounded annual growth rate. Its growth beat the average software company and shows its offerings resonate with customers, a helpful starting point for our analysis.
We at StockStory place the most emphasis on long-term growth, but within software, a half-decade historical view may miss recent innovations or disruptive industry trends. Upstart’s annualized revenue growth of 36.3% over the last two years aligns with its five-year trend, suggesting its demand was predictably strong. 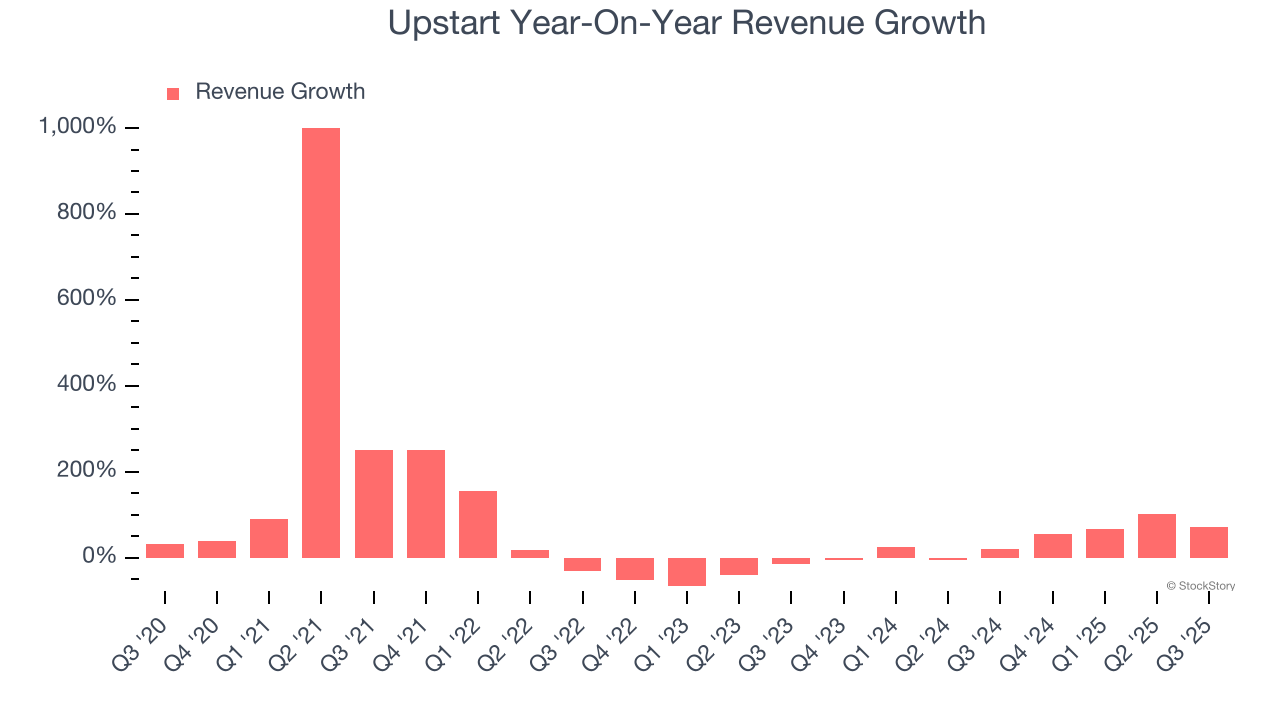
This quarter, Upstart achieved a magnificent 70.9% year-on-year revenue growth rate, but its $277.1 million of revenue fell short of Wall Street’s lofty estimates. Company management is currently guiding for a 31.5% year-on-year increase in sales next quarter.
Looking further ahead, sell-side analysts expect revenue to grow 32.8% over the next 12 months, a deceleration versus the last two years. Despite the slowdown, this projection is healthy and indicates the market sees success for its products and services.
Microsoft, Alphabet, Coca-Cola, Monster Beverage—all began as under-the-radar growth stories riding a massive trend. We’ve identified the next one: a profitable AI semiconductor play Wall Street is still overlooking. Go here for access to our full report.
Total Transaction Volume
Total transaction volumes show the aggregate dollar value of loans processed on Upstart’s platform. This is the number from which the company will ultimately collect fees, and the higher it is, the more accurate its software becomes at assessing credit risk.
Upstart’s transaction volume punched in at $2.85 billion in Q3, and over the last four quarters, its growth was fantastic as it averaged 97.8% year-on-year increases. This alternate topline metric grew faster than total sales, meaning its loan processing fees outpaced the interest income from loans retained on its balance sheet. If this trend continues, it would lower Upstart’s risk profile as it would reduce its exposure to delinquencies and defaults. 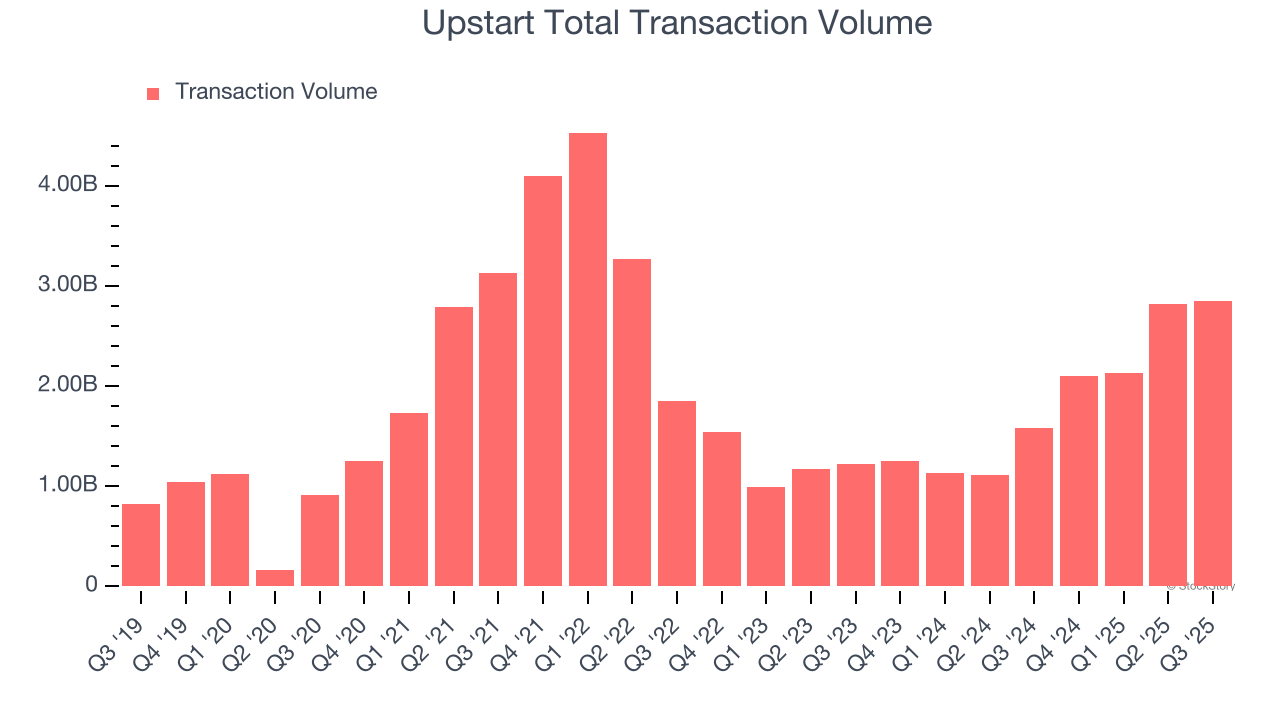
Customer Acquisition Efficiency
The customer acquisition cost (CAC) payback period represents the months required to recover the cost of acquiring a new customer. Essentially, it’s the break-even point for sales and marketing investments. A shorter CAC payback period is ideal, as it implies better returns on investment and business scalability.
Upstart’s recent customer acquisition efforts haven’t yielded returns as its CAC payback period was negative this quarter, meaning its incremental sales and marketing investments outpaced its revenue. The company’s inefficiency indicates it operates in a competitive market and must continue investing to grow.
Key Takeaways from Upstart’s Q3 Results
We were impressed by how significantly Upstart blew past analysts’ EBITDA expectations this quarter. On the other hand, its full-year revenue guidance missed and its transaction volume fell short of Wall Street’s estimates. Overall, this quarter could have been better. The stock traded down 13.6% to $40 immediately after reporting.
Upstart didn’t show it’s best hand this quarter, but does that create an opportunity to buy the stock right now? When making that decision, it’s important to consider its valuation, business qualities, as well as what has happened in the latest quarter. We cover that in our actionable full research report which you can read here, it’s free for active Edge members.