
REV Group has been on fire lately. In the past six months alone, the company’s stock price has rocketed 51.9%, reaching $54.14 per share. This was partly due to its solid quarterly results, and the run-up might have investors contemplating their next move.
Is now the time to buy REV Group, or should you be careful about including it in your portfolio? Get the full stock story straight from our expert analysts, it’s free for active Edge members.
Why Is REV Group Not Exciting?
Despite the momentum, we're sitting this one out for now. Here are three reasons we avoid REVG and a stock we'd rather own.
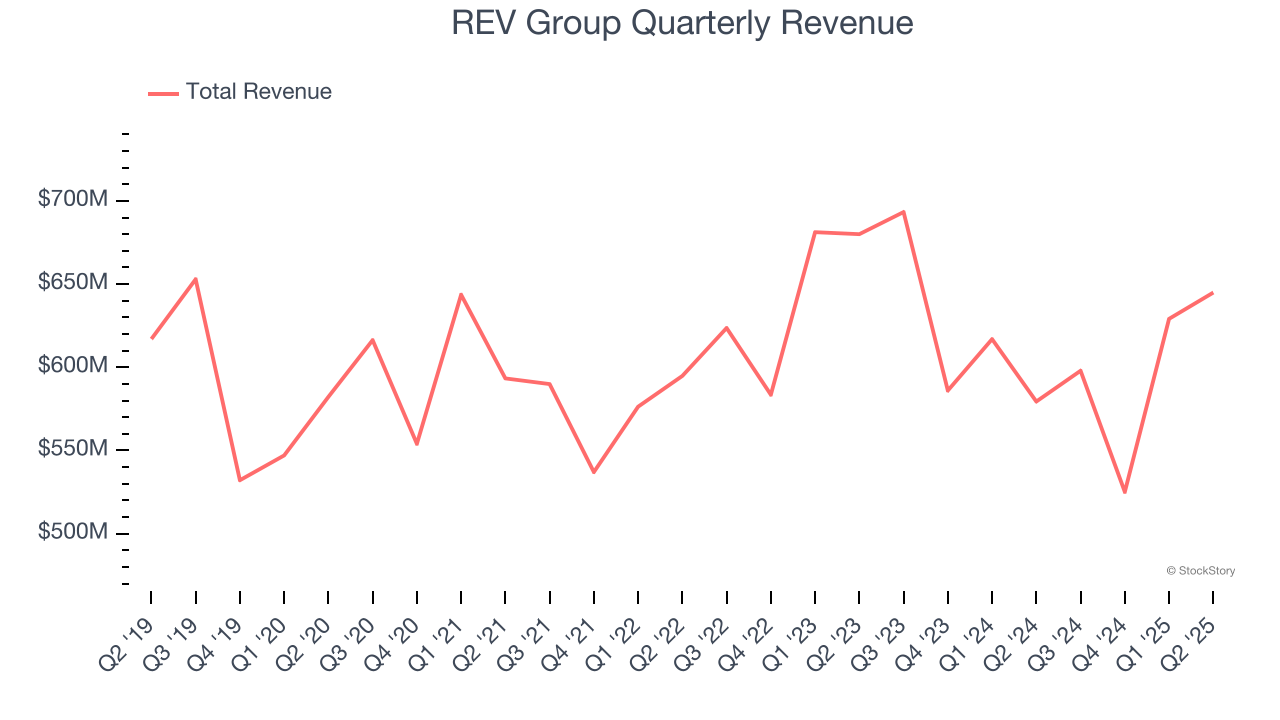
1. Long-Term Revenue Growth Flatter Than a Pancake
A company’s long-term sales performance can indicate its overall quality. Any business can put up a good quarter or two, but the best consistently grow over the long haul. Unfortunately, REV Group struggled to consistently increase demand as its $2.40 billion of sales for the trailing 12 months was close to its revenue five years ago. This was below our standards and signals it’s a lower quality business.
2. Low Gross Margin Reveals Weak Structural Profitability
At StockStory, we prefer high gross margin businesses because they indicate the company has pricing power or differentiated products, giving it a chance to generate higher operating profits.
REV Group has bad unit economics for an industrials business, signaling it operates in a competitive market. As you can see below, it averaged a 12.2% gross margin over the last five years. Said differently, REV Group had to pay a chunky $87.81 to its suppliers for every $100 in revenue. 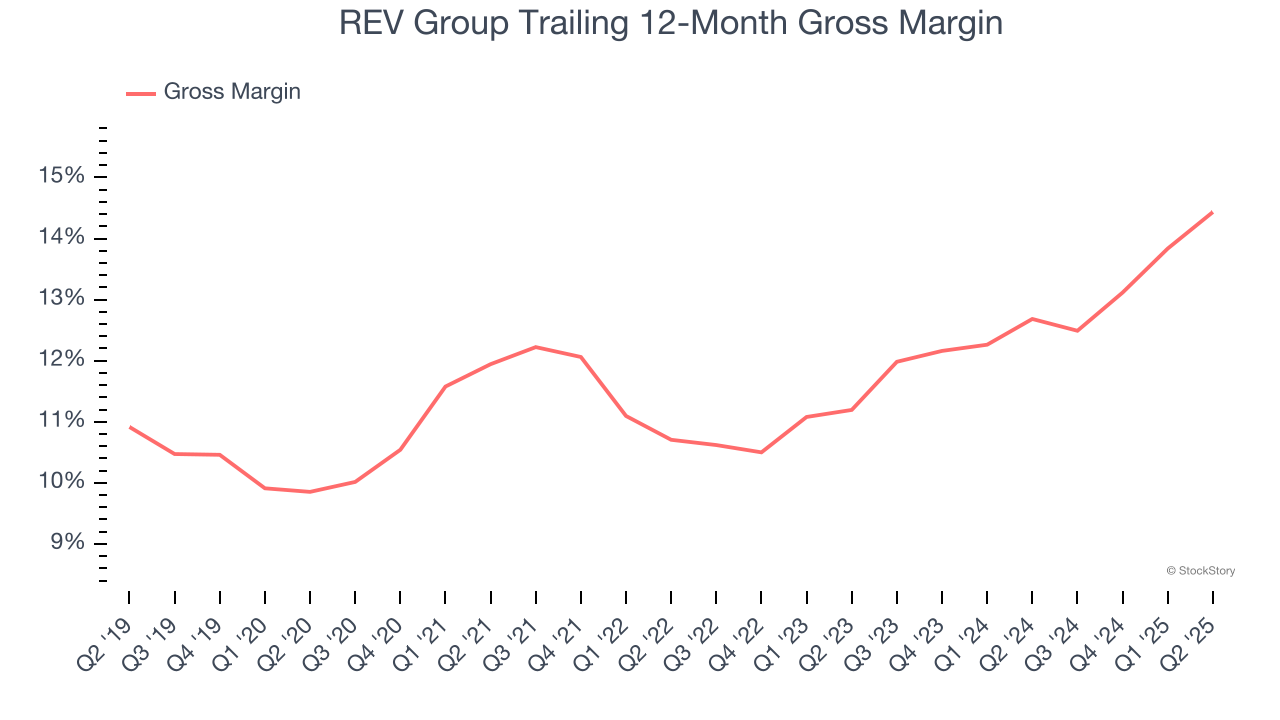
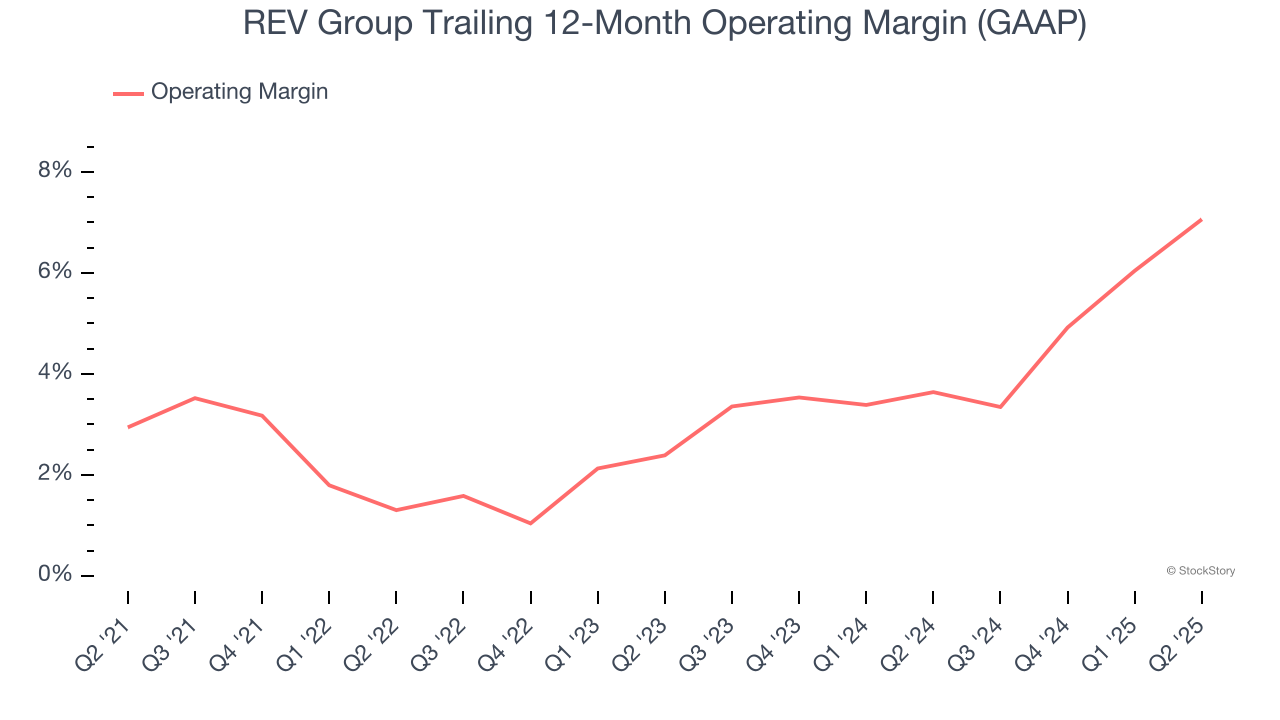
3. Weak Operating Margin Could Cause Trouble
Operating margin is one of the best measures of profitability because it tells us how much money a company takes home after procuring and manufacturing its products, marketing and selling those products, and most importantly, keeping them relevant through research and development.
REV Group was profitable over the last five years but held back by its large cost base. Its average operating margin of 3.5% was weak for an industrials business. This result isn’t too surprising given its low gross margin as a starting point.
Final Judgment
REV Group isn’t a terrible business, but it isn’t one of our picks. Following the recent rally, the stock trades at 16.3× forward P/E (or $54.14 per share). While this valuation is reasonable, we don’t really see a big opportunity at the moment. We're fairly confident there are better investments elsewhere. Let us point you toward a safe-and-steady industrials business benefiting from an upgrade cycle.
High-Quality Stocks for All Market Conditions
Trump’s April 2025 tariff bombshell triggered a massive market selloff, but stocks have since staged an impressive recovery, leaving those who panic sold on the sidelines.
Take advantage of the rebound by checking out our Top 5 Growth Stocks for this month. This is a curated list of our High Quality stocks that have generated a market-beating return of 183% over the last five years (as of March 31st 2025).
Stocks that made our list in 2020 include now familiar names such as Nvidia (+1,545% between March 2020 and March 2025) as well as under-the-radar businesses like the once-small-cap company Exlservice (+354% five-year return). Find your next big winner with StockStory today.
StockStory is growing and hiring equity analyst and marketing roles. Are you a 0 to 1 builder passionate about the markets and AI? See the open roles here.


