
Behavioral health company Acadia Healthcare (NASDAQ: ACHC) beat Wall Street’s revenue expectations in Q3 CY2025, with sales up 4.4% year on year to $851.6 million. On the other hand, the company’s full-year revenue guidance of $3.29 billion at the midpoint came in 0.7% below analysts’ estimates. Its non-GAAP profit of $0.72 per share was 9.1% above analysts’ consensus estimates.
Is now the time to buy Acadia Healthcare? Find out by accessing our full research report, it’s free for active Edge members.
Acadia Healthcare (ACHC) Q3 CY2025 Highlights:
- Revenue: $851.6 million vs analyst estimates of $846 million (4.4% year-on-year growth, 0.7% beat)
- Adjusted EPS: $0.72 vs analyst estimates of $0.66 (9.1% beat)
- Adjusted EBITDA: $173 million vs analyst estimates of $178.4 million (20.3% margin, 3% miss)
- The company dropped its revenue guidance for the full year to $3.29 billion at the midpoint from $3.33 billion, a 1.1% decrease
- Management lowered its full-year Adjusted EPS guidance to $2.40 at the midpoint, a 5.9% decrease
- EBITDA guidance for the full year is $655 million at the midpoint, below analyst estimates of $683.7 million
- Operating Margin: 4.7%, down from 15.8% in the same quarter last year
- Free Cash Flow was -$63.03 million compared to -$27.11 million in the same quarter last year
- Sales Volumes were flat year on year (2.4% in the same quarter last year)
- Market Capitalization: $1.91 billion
“Acadia delivered solid revenue performance in the third quarter despite a challenging operating environment,” said Chris Hunter, Chief Executive Officer of Acadia.
Company Overview
With a network of over 250 facilities serving patients in 38 states and Puerto Rico, Acadia Healthcare (NASDAQ: ACHC) operates facilities providing mental health and substance use disorder treatment services across the United States.
Revenue Growth
A company’s long-term sales performance is one signal of its overall quality. Any business can have short-term success, but a top-tier one grows for years. Over the last five years, Acadia Healthcare grew its sales at a mediocre 7% compounded annual growth rate. This was below our standard for the healthcare sector and is a poor baseline for our analysis.
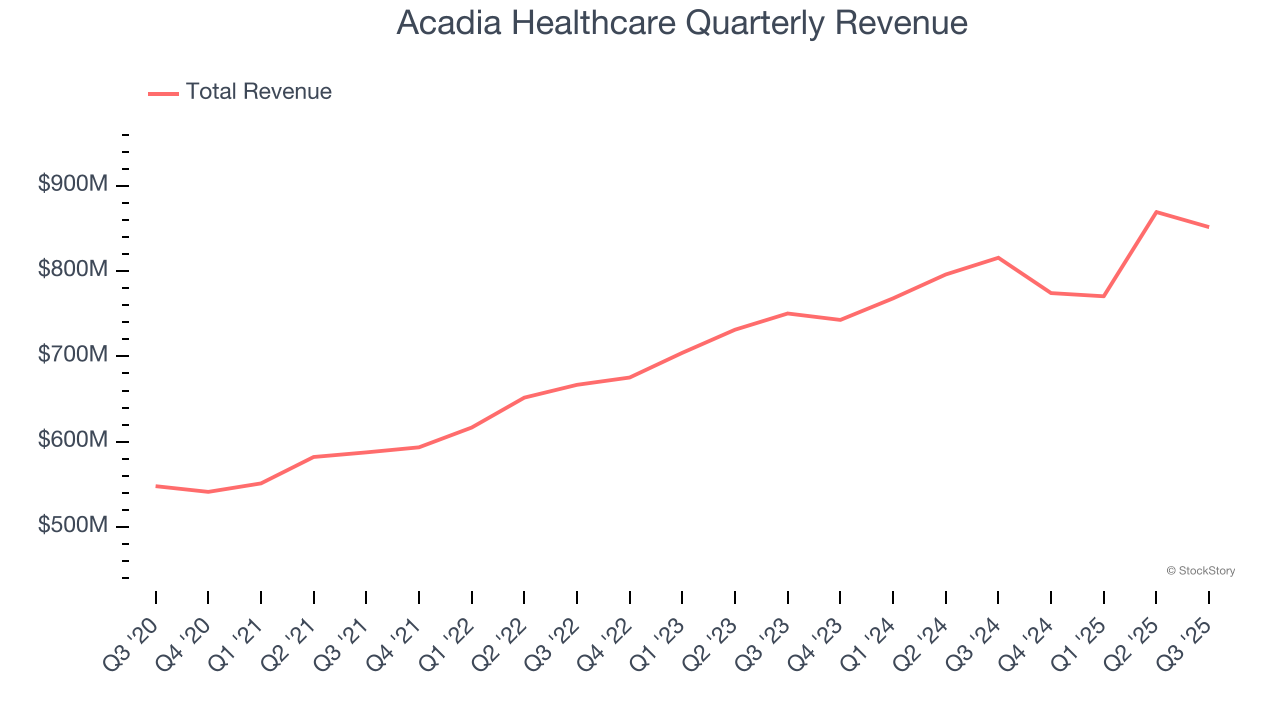
We at StockStory place the most emphasis on long-term growth, but within healthcare, a half-decade historical view may miss recent innovations or disruptive industry trends. Acadia Healthcare’s annualized revenue growth of 6.8% over the last two years aligns with its five-year trend, suggesting its demand was consistently weak. 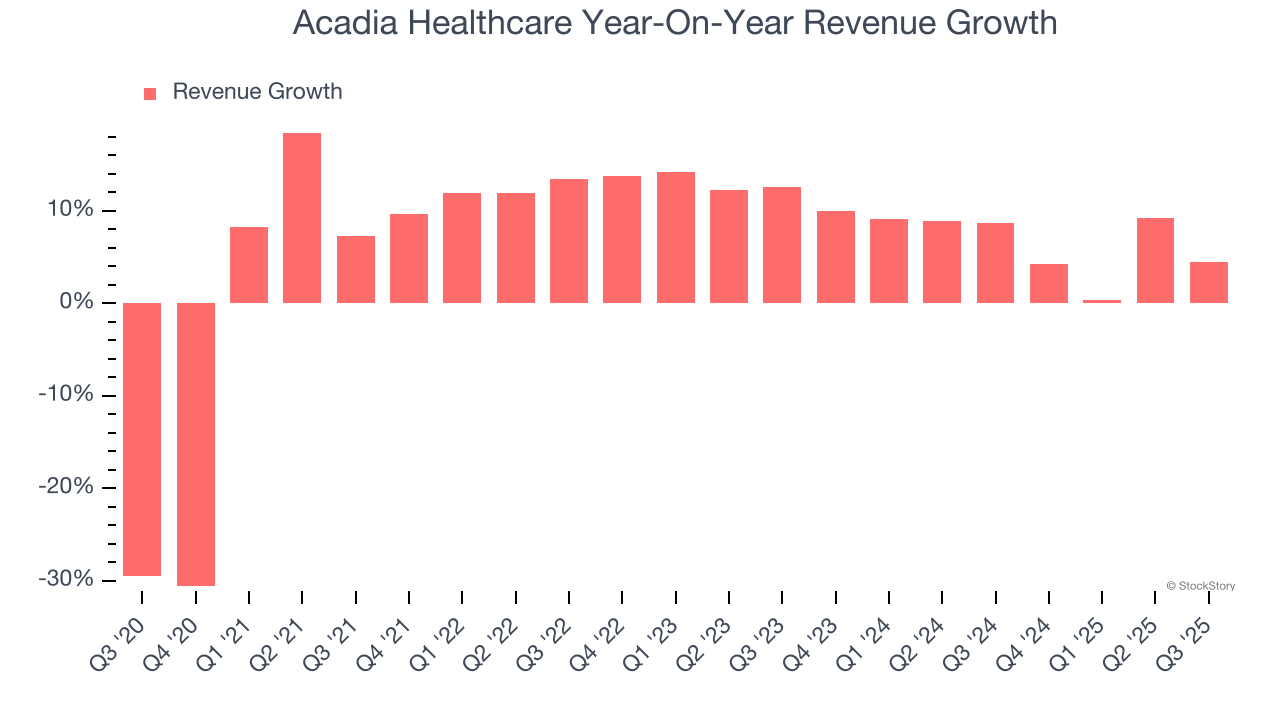
We can dig further into the company’s revenue dynamics by analyzing its number of admissions, which reached 51,966 in the latest quarter. Over the last two years, Acadia Healthcare’s admissions averaged 1.4% year-on-year growth. Because this number is lower than its revenue growth, we can see the company benefited from price increases. 
This quarter, Acadia Healthcare reported modest year-on-year revenue growth of 4.4% but beat Wall Street’s estimates by 0.7%.
Looking ahead, sell-side analysts expect revenue to grow 6.6% over the next 12 months, similar to its two-year rate. This projection is above the sector average and indicates its newer products and services will help maintain its recent top-line performance.
While Wall Street chases Nvidia at all-time highs, an under-the-radar semiconductor supplier is dominating a critical AI component these giants can’t build without. Click here to access our free report one of our favorites growth stories.
Operating Margin
Acadia Healthcare has done a decent job managing its cost base over the last five years. The company has produced an average operating margin of 11.4%, higher than the broader healthcare sector.
Analyzing the trend in its profitability, Acadia Healthcare’s operating margin decreased by 8.6 percentage points over the last five years, but it rose by 5 percentage points on a two-year basis. Still, shareholders will want to see Acadia Healthcare become more profitable in the future.
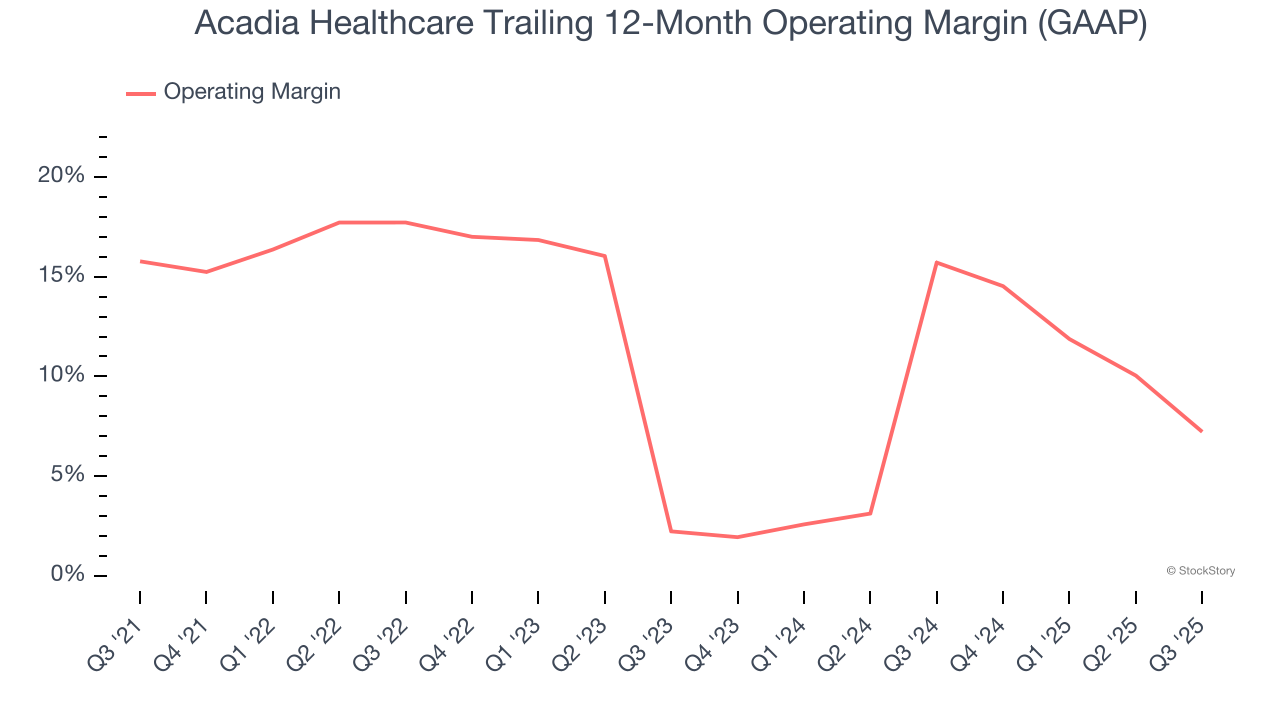
In Q3, Acadia Healthcare generated an operating margin profit margin of 4.7%, down 11.1 percentage points year on year. This contraction shows it was less efficient because its expenses grew faster than its revenue.
Earnings Per Share
We track the long-term change in earnings per share (EPS) for the same reason as long-term revenue growth. Compared to revenue, however, EPS highlights whether a company’s growth is profitable.
Acadia Healthcare’s EPS grew at an unimpressive 3.8% compounded annual growth rate over the last five years, lower than its 7% annualized revenue growth. This tells us the company became less profitable on a per-share basis as it expanded.
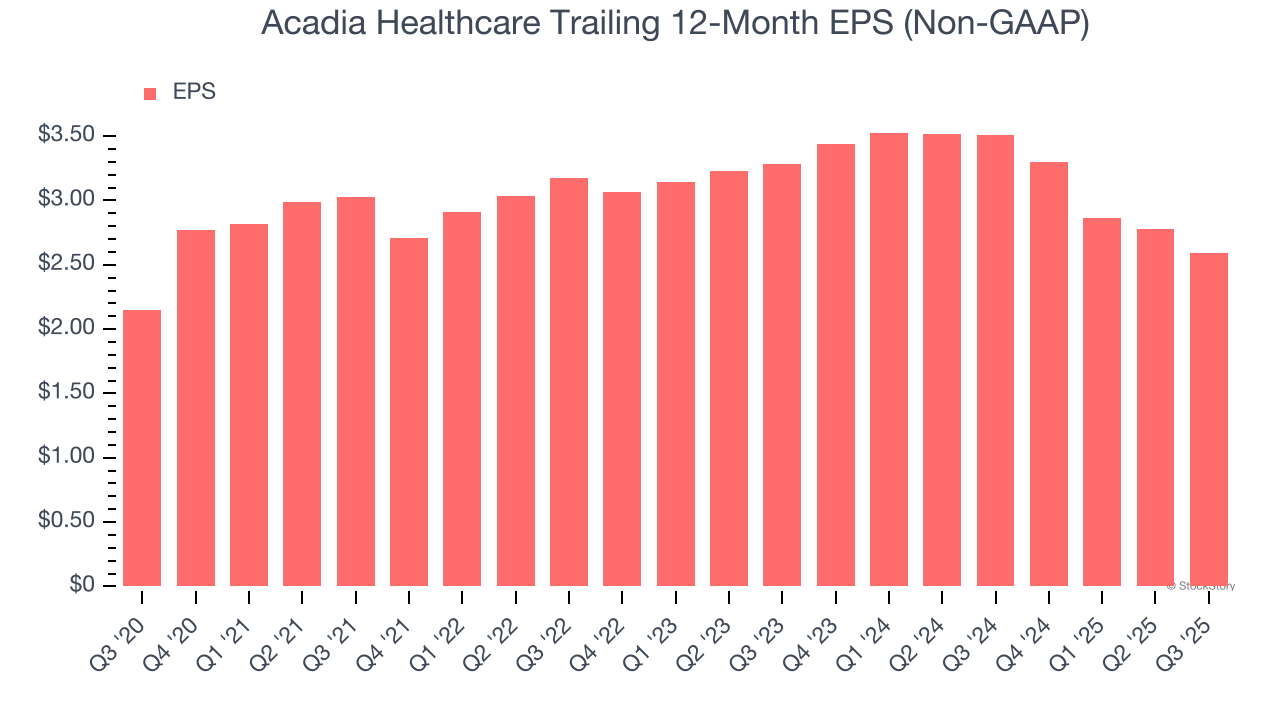
We can take a deeper look into Acadia Healthcare’s earnings to better understand the drivers of its performance. As we mentioned earlier, Acadia Healthcare’s operating margin declined by 8.6 percentage points over the last five years. Its share count also grew by 1.9%, meaning the company not only became less efficient with its operating expenses but also diluted its shareholders. 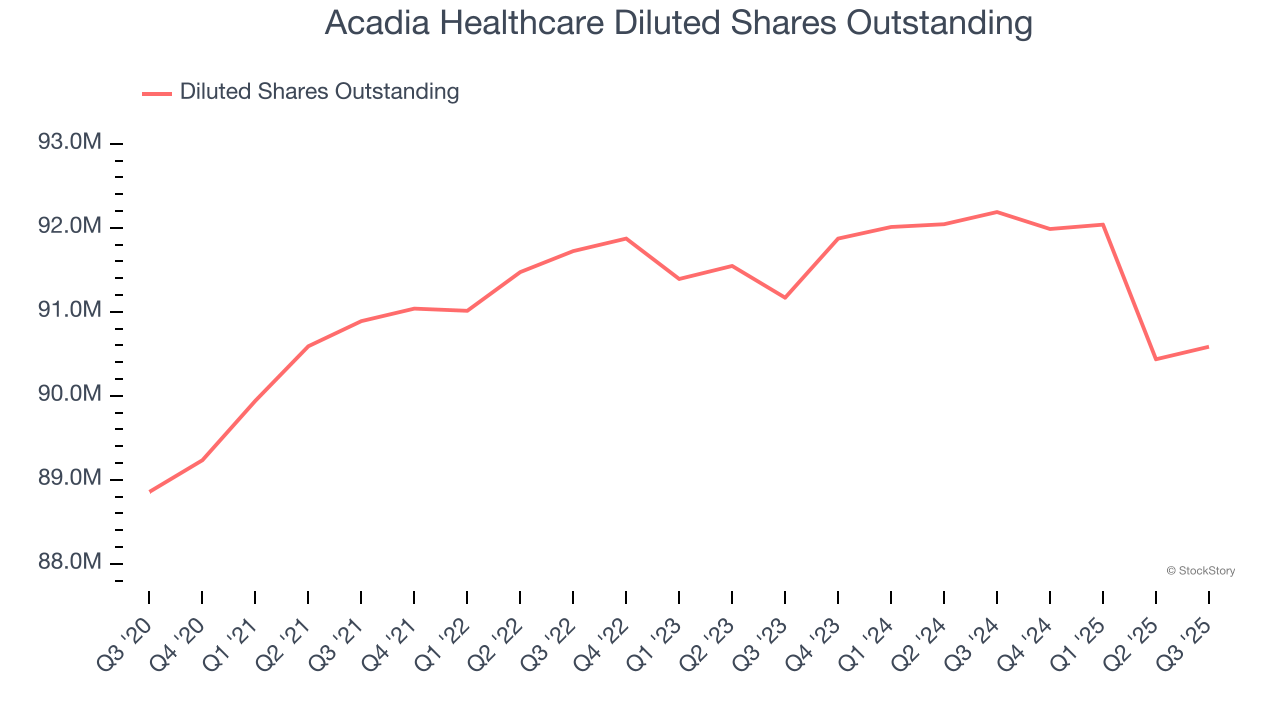
In Q3, Acadia Healthcare reported adjusted EPS of $0.72, down from $0.91 in the same quarter last year. Despite falling year on year, this print beat analysts’ estimates by 9.1%. Over the next 12 months, Wall Street expects Acadia Healthcare’s full-year EPS of $2.59 to shrink by 2.5%.
Key Takeaways from Acadia Healthcare’s Q3 Results
It was good to see Acadia Healthcare beat analysts’ EPS expectations this quarter. We were also happy its revenue narrowly outperformed Wall Street’s estimates. On the other hand, its full-year EPS guidance missed and its full-year EBITDA guidance fell short of Wall Street’s estimates. Overall, this was a softer quarter. The stock traded down 8.8% to $18.85 immediately after reporting.
The latest quarter from Acadia Healthcare’s wasn’t that good. One earnings report doesn’t define a company’s quality, though, so let’s explore whether the stock is a buy at the current price. We think that the latest quarter is only one piece of the longer-term business quality puzzle. Quality, when combined with valuation, can help determine if the stock is a buy. We cover that in our actionable full research report which you can read here, it’s free for active Edge members.