
Insurance giant Allstate (NYSE: ALL) reported revenue ahead of Wall Streets expectations in Q3 CY2025, with sales up 3.8% year on year to $17.26 billion. Its non-GAAP profit of $11.17 per share was 48.1% above analysts’ consensus estimates.
Is now the time to buy Allstate? Find out by accessing our full research report, it’s free for active Edge members.
Allstate (ALL) Q3 CY2025 Highlights:
Company Overview
Born from a Sears, Roebuck & Co. initiative during the Great Depression with its famous "You're in good hands" slogan, Allstate (NYSE: ALL) is one of America's largest personal property and casualty insurers, offering protection for autos, homes, and personal property.
Revenue Growth
Insurance companies generate revenue three ways. The first is the core insurance business itself, represented in the income statement as premiums earned. The second source is investment income from investing the “float” (premiums collected but not yet paid out as claims) in assets such as fixed-income assets and equities. The third is fees from policy administration, annuities, and other value-added services. Thankfully, Allstate’s 9.9% annualized revenue growth over the last five years was solid. Its growth beat the average insurance company and shows its offerings resonate with customers.
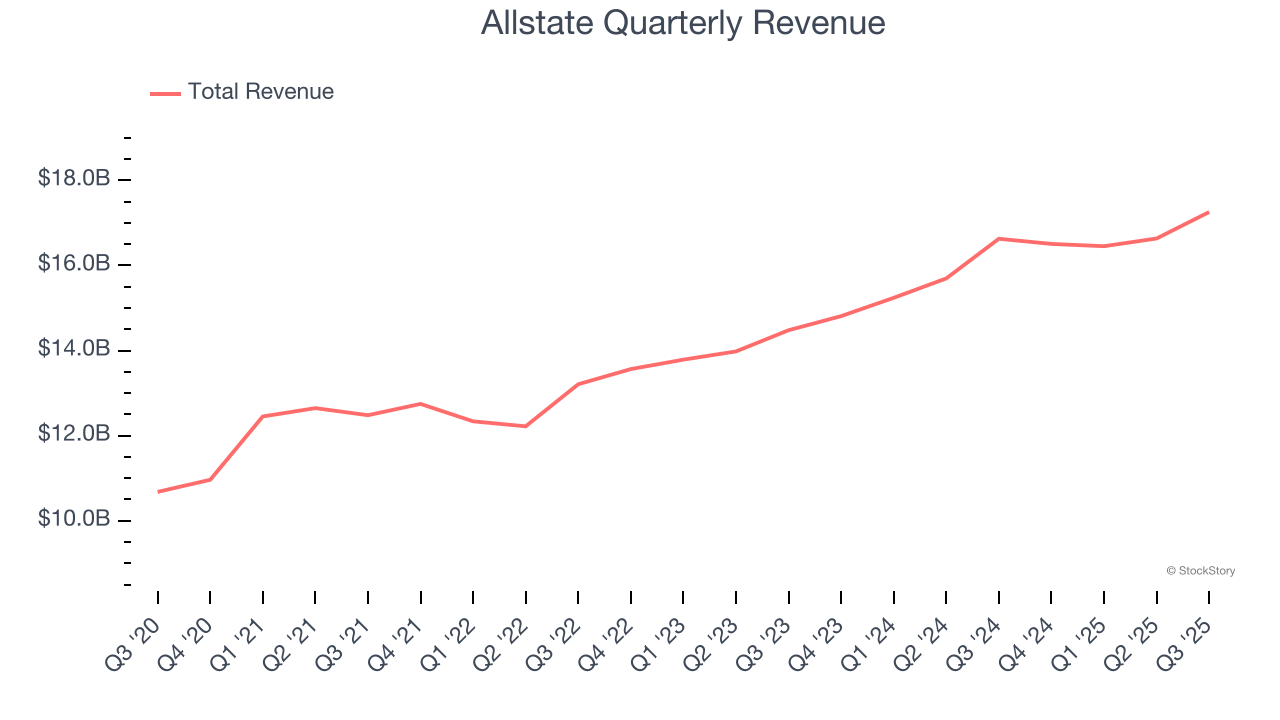
We at StockStory place the most emphasis on long-term growth, but within financials, a half-decade historical view may miss recent interest rate changes, market returns, and industry trends. Allstate’s annualized revenue growth of 9.4% over the last two years aligns with its five-year trend, suggesting its demand was predictably strong. 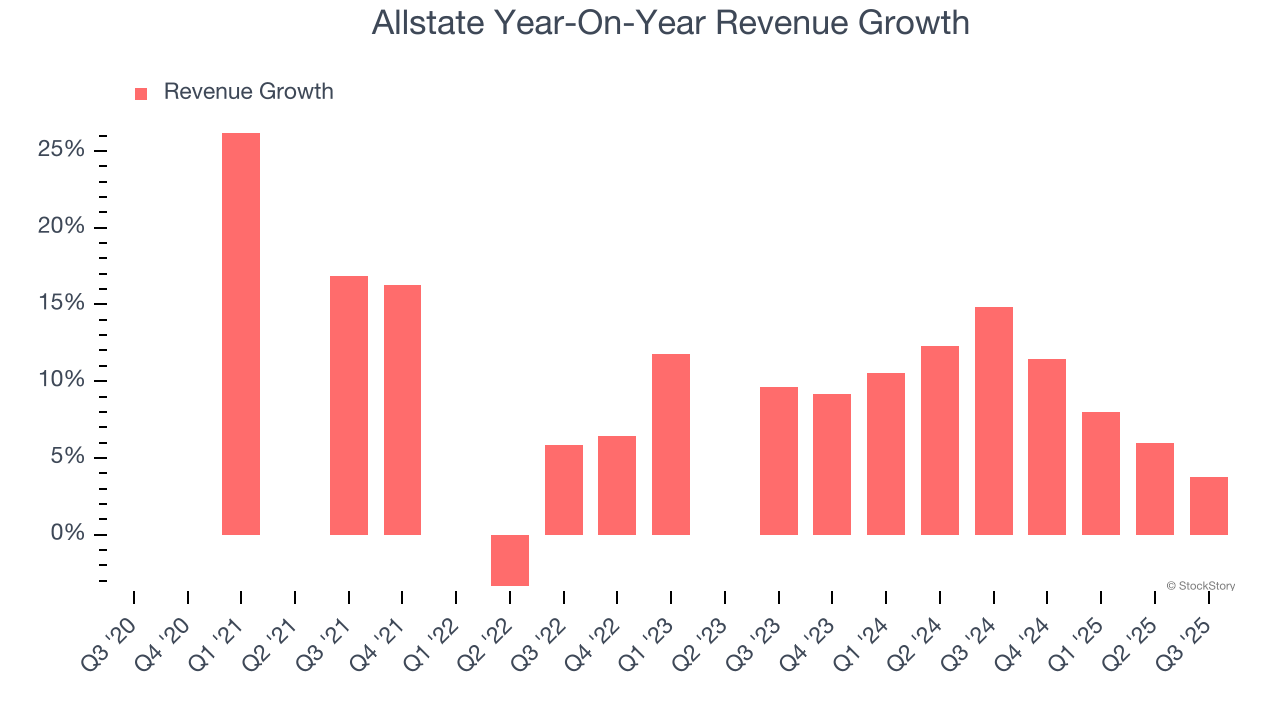 Note: Quarters not shown were determined to be outliers, impacted by outsized investment gains/losses that are not indicative of the recurring fundamentals of the business.
This quarter, Allstate reported modest year-on-year revenue growth of 3.8% but beat Wall Street’s estimates by 2.8%.
Net premiums earned made up 90.8% of the company’s total revenue during the last five years, meaning Allstate lives and dies by its underwriting activities because non-insurance operations barely move the needle.
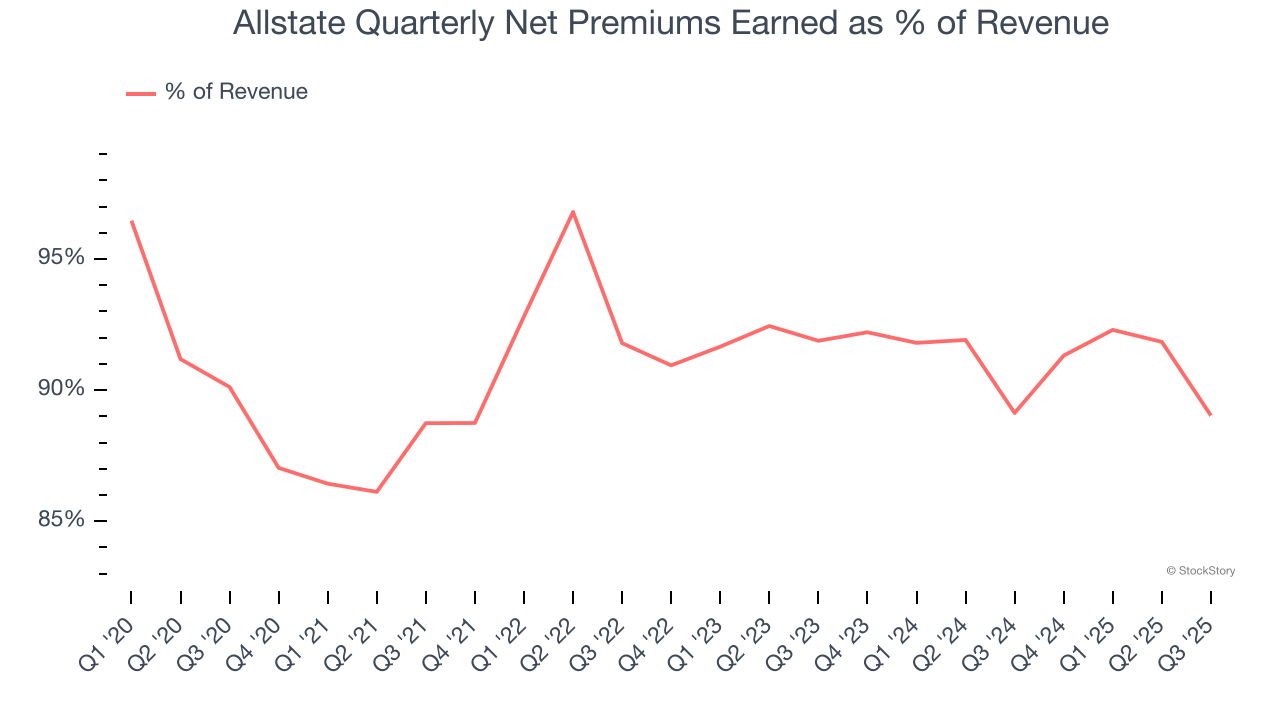
While insurers generate revenue from multiple sources, investors view net premiums earned as the cornerstone - its direct link to core operations stands in sharp contrast to the unpredictability of investment returns and fees.
Software is eating the world and there is virtually no industry left that has been untouched by it. That drives increasing demand for tools helping software developers do their jobs, whether it be monitoring critical cloud infrastructure, integrating audio and video functionality, or ensuring smooth content streaming. Click here to access a free report on our 3 favorite stocks to play this generational megatrend.
Net Premiums Earned
Net premiums earned are net of what’s paid to reinsurers (insurance for insurance companies), which are used by insurers to protect themselves from large losses.
Allstate’s net premiums earned has grown at a 9.9% annualized rate over the last five years, a step above the broader insurance industry and in line with its total revenue.
When analyzing Allstate’s net premiums earned over the last two years, we can paint a similar picture as it recorded an annual growth rate of 9.1%. This performance was similar to its total revenue.
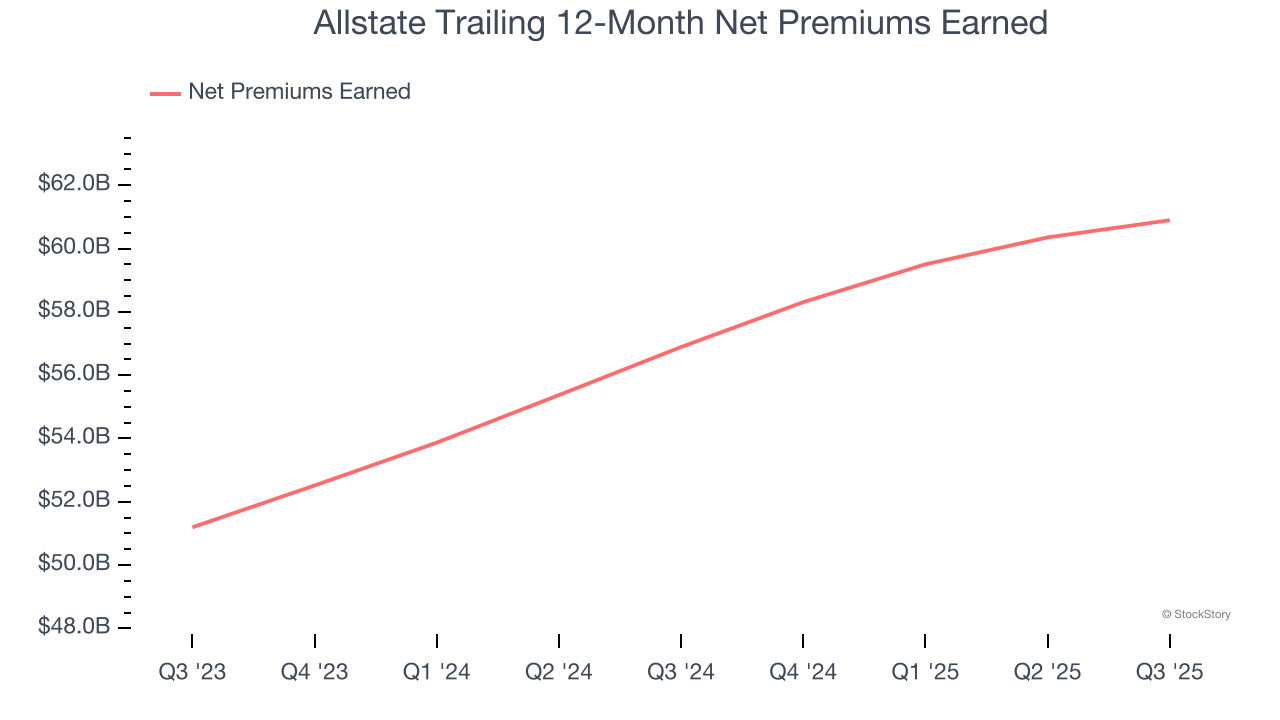
Allstate produced $15.36 billion of net premiums earned in Q3, up 3.7% year on year and topping Wall Street Consensus estimates by 4.7%.
Key Takeaways from Allstate’s Q3 Results
It was good to see Allstate beat analysts’ EPS expectations this quarter. We were also excited its net premiums earned outperformed Wall Street’s estimates by a wide margin. Zooming out, we think this was a solid print. The stock traded up 1.5% to $197.80 immediately after reporting.
Indeed, Allstate had a rock-solid quarterly earnings result, but is this stock a good investment here? If you’re making that decision, you should consider the bigger picture of valuation, business qualities, as well as the latest earnings. We cover that in our actionable full research report which you can read here, it’s free for active Edge members.