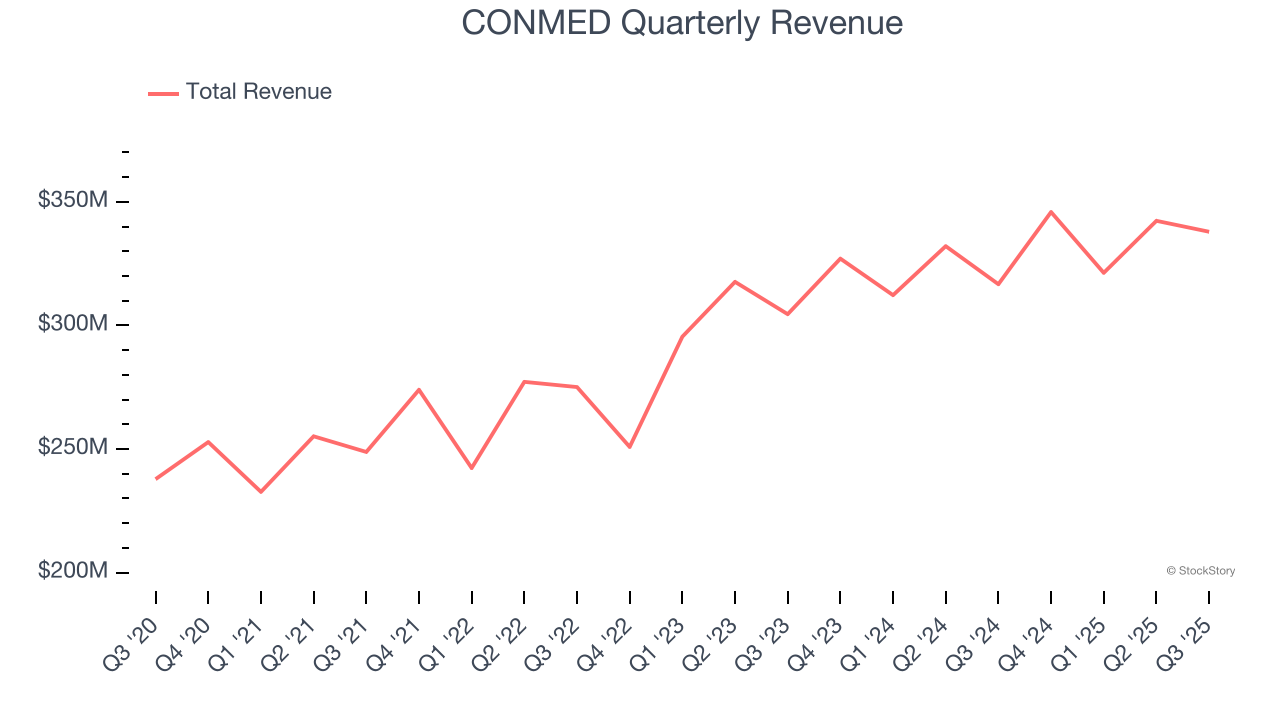
Medical tech company CONMED (NYSE: CNMD) announced better-than-expected revenue in Q3 CY2025, with sales up 6.7% year on year to $337.9 million. The company expects the full year’s revenue to be around $1.37 billion, close to analysts’ estimates. Its non-GAAP profit of $1.08 per share was 2.7% above analysts’ consensus estimates.
Is now the time to buy CONMED? Find out by accessing our full research report, it’s free for active Edge members.
CONMED (CNMD) Q3 CY2025 Highlights:
- Revenue: $337.9 million vs analyst estimates of $334.5 million (6.7% year-on-year growth, 1% beat)
- Adjusted EPS: $1.08 vs analyst estimates of $1.05 (2.7% beat)
- The company slightly lifted its revenue guidance for the full year to $1.37 billion at the midpoint from $1.37 billion
- Management slightly raised its full-year Adjusted EPS guidance to $4.51 at the midpoint
- Operating Margin: 3.5%, down from 20.7% in the same quarter last year
- Constant Currency Revenue rose 6.3% year on year (4.3% in the same quarter last year)
- Market Capitalization: $1.41 billion
Company Overview
With over five decades of experience in surgical innovation since its founding in 1970, CONMED (NYSE: CNMD) develops and manufactures medical devices and equipment for surgical procedures, specializing in orthopedic and general surgery products.
Revenue Growth
A company’s long-term sales performance is one signal of its overall quality. Any business can put up a good quarter or two, but many enduring ones grow for years. Luckily, CONMED’s sales grew at a decent 9% compounded annual growth rate over the last five years. Its growth was slightly above the average healthcare company and shows its offerings resonate with customers.
Long-term growth is the most important, but within healthcare, a half-decade historical view may miss new innovations or demand cycles. CONMED’s recent performance shows its demand has slowed as its annualized revenue growth of 7.4% over the last two years was below its five-year trend. 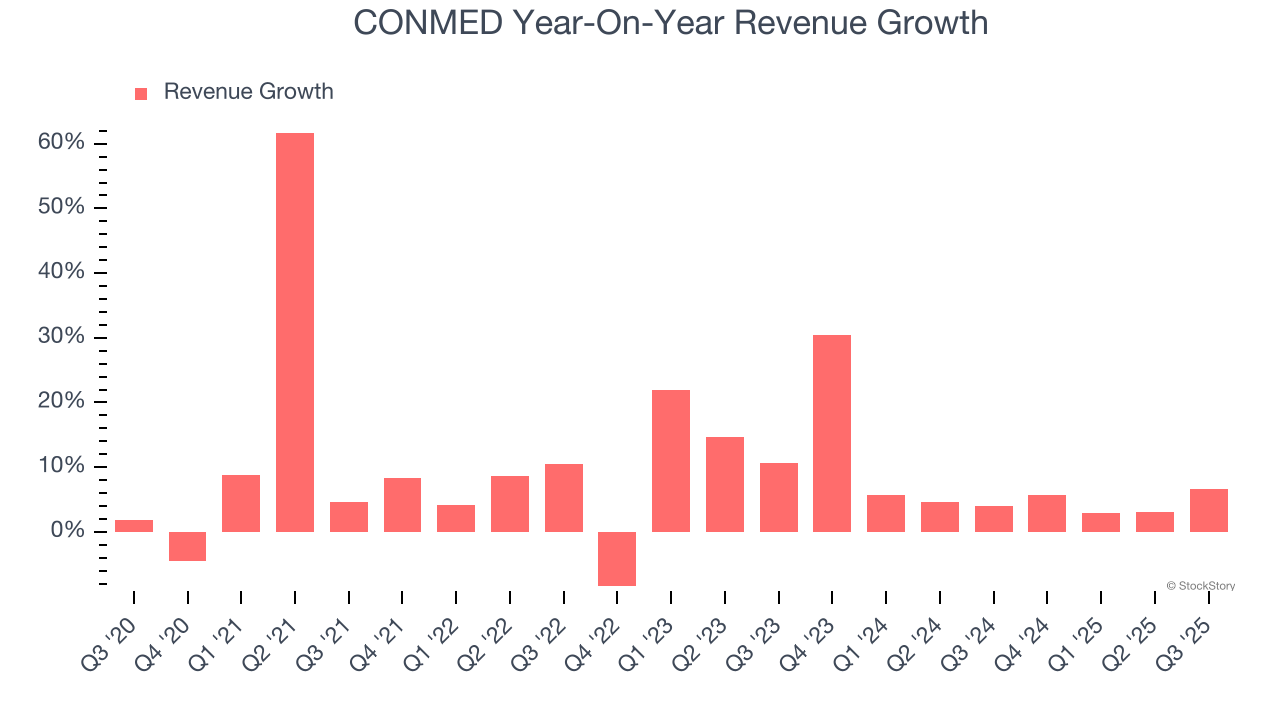
We can dig further into the company’s sales dynamics by analyzing its constant currency revenue, which excludes currency movements that are outside their control and not indicative of demand. Over the last two years, its constant currency sales averaged 8.2% year-on-year growth. Because this number aligns with its normal revenue growth, we can see that CONMED has properly hedged its foreign currency exposure. 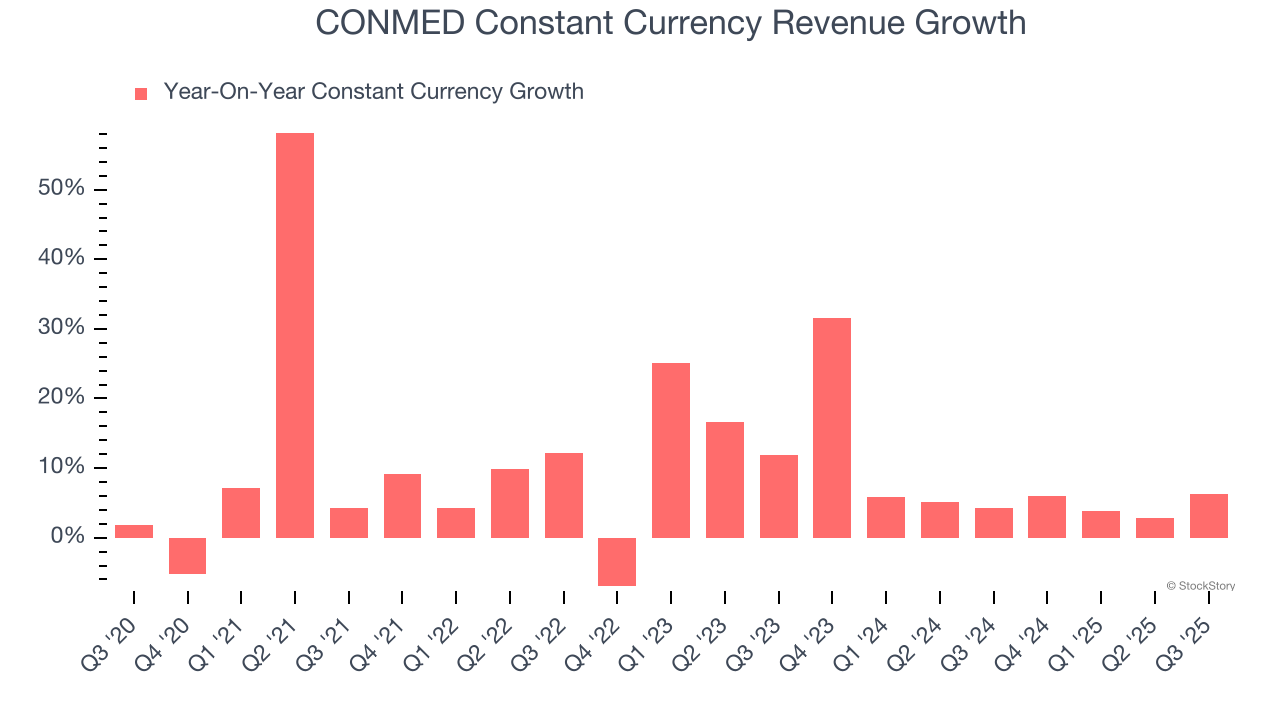
This quarter, CONMED reported year-on-year revenue growth of 6.7%, and its $337.9 million of revenue exceeded Wall Street’s estimates by 1%.
Looking ahead, sell-side analysts expect revenue to grow 5.4% over the next 12 months, a slight deceleration versus the last two years. Still, this projection is above average for the sector and implies the market sees some success for its newer products and services.
Microsoft, Alphabet, Coca-Cola, Monster Beverage—all began as under-the-radar growth stories riding a massive trend. We’ve identified the next one: a profitable AI semiconductor play Wall Street is still overlooking. Go here for access to our full report.
Operating Margin
Operating margin is one of the best measures of profitability because it tells us how much money a company takes home after subtracting all core expenses, like marketing and R&D.
CONMED has done a decent job managing its cost base over the last five years. The company has produced an average operating margin of 10.1%, higher than the broader healthcare sector.
Looking at the trend in its profitability, CONMED’s operating margin decreased by 1 percentage points over the last five years, but it rose by 2.9 percentage points on a two-year basis. Still, shareholders will want to see CONMED become more profitable in the future.
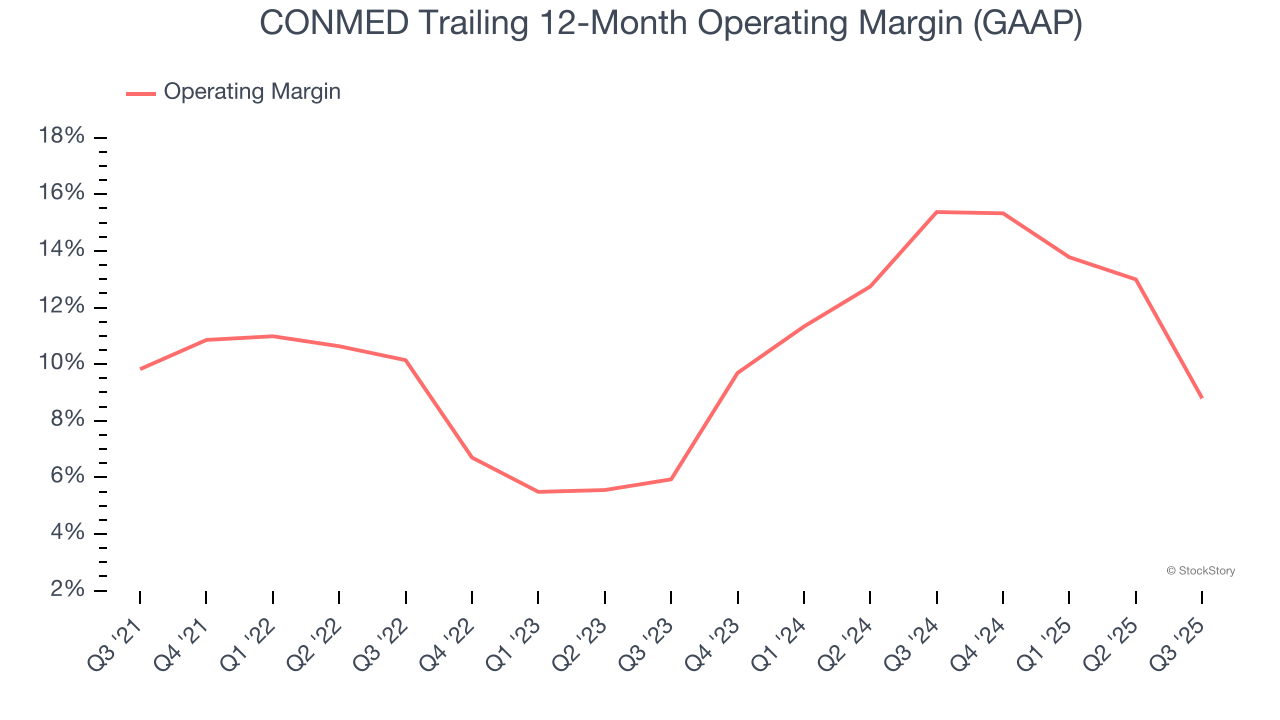
In Q3, CONMED generated an operating margin profit margin of 3.5%, down 17.2 percentage points year on year. This contraction shows it was less efficient because its expenses grew faster than its revenue.
Earnings Per Share
We track the long-term change in earnings per share (EPS) for the same reason as long-term revenue growth. Compared to revenue, however, EPS highlights whether a company’s growth is profitable.
CONMED’s EPS grew at an astounding 15.3% compounded annual growth rate over the last five years, higher than its 9% annualized revenue growth. However, we take this with a grain of salt because its operating margin didn’t improve and it didn’t repurchase its shares, meaning the delta came from reduced interest expenses or taxes.
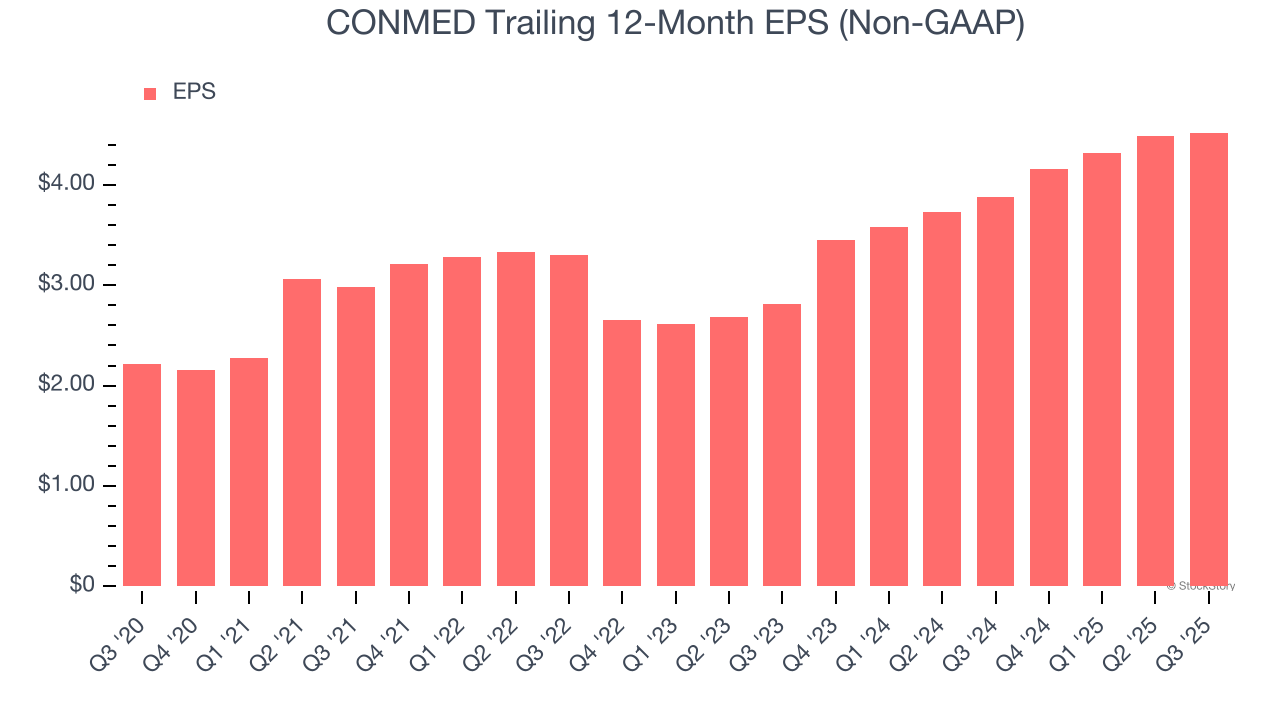
In Q3, CONMED reported adjusted EPS of $1.08, up from $1.05 in the same quarter last year. This print beat analysts’ estimates by 2.7%. Over the next 12 months, Wall Street expects CONMED’s full-year EPS of $4.52 to grow 3.3%.
Key Takeaways from CONMED’s Q3 Results
It was good to see CONMED narrowly top analysts’ constant currency revenue expectations this quarter. We were also happy its revenue narrowly outperformed Wall Street’s estimates. Overall, this print had some key positives. The stock traded up 5.6% to $46.91 immediately after reporting.
Is CONMED an attractive investment opportunity at the current price? If you’re making that decision, you should consider the bigger picture of valuation, business qualities, as well as the latest earnings. We cover that in our actionable full research report which you can read here, it’s free for active Edge members.


