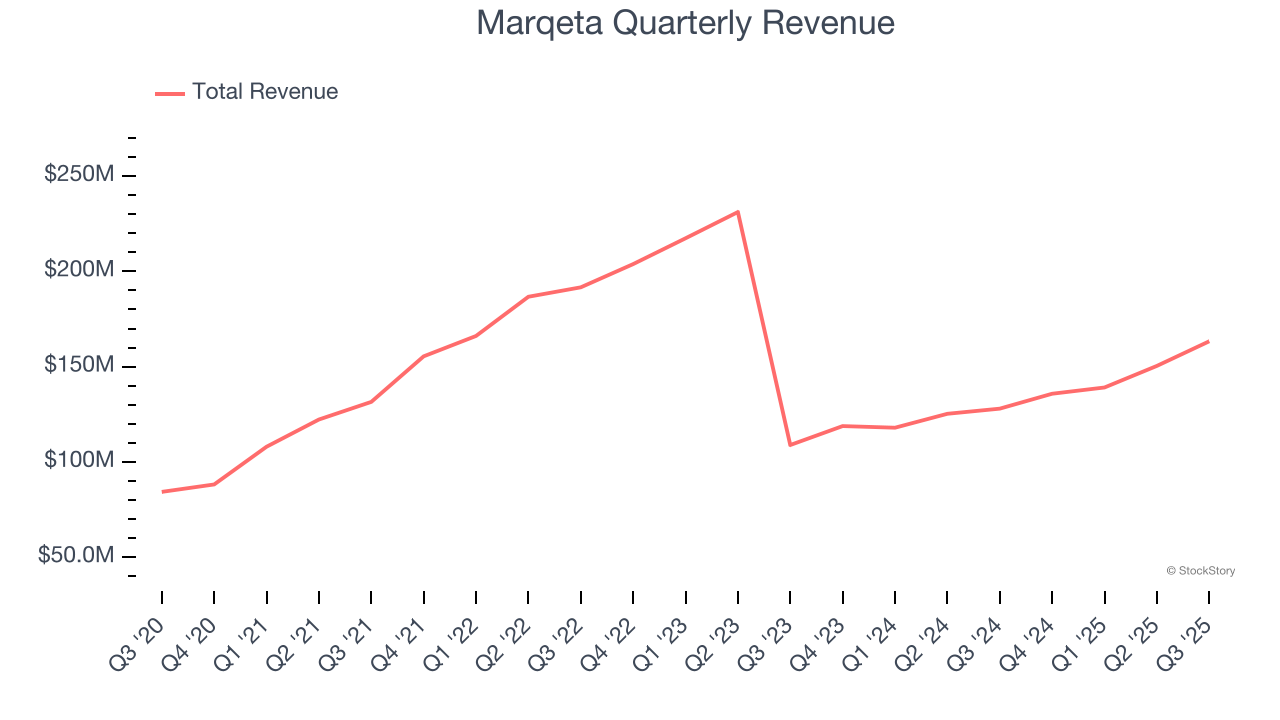
Payment technology company Marqeta (NASDAQ: MQ) reported Q3 CY2025 results topping the market’s revenue expectations, with sales up 27.6% year on year to $163.3 million. On top of that, next quarter’s revenue guidance ($167 million at the midpoint) was surprisingly good and 5.6% above what analysts were expecting. Its GAAP loss of $0.01 per share was in line with analysts’ consensus estimates.
Is now the time to buy Marqeta? Find out by accessing our full research report, it’s free for active Edge members.
Marqeta (MQ) Q3 CY2025 Highlights:
- Revenue: $163.3 million vs analyst estimates of $148.8 million (27.6% year-on-year growth, 9.7% beat)
- EPS (GAAP): -$0.01 vs analyst estimates of -$0.02 (in line)
- Revenue Guidance for Q4 CY2025 is $167 million at the midpoint, above analyst estimates of $158.1 million
- Operating Margin: -6.4%, up from -33% in the same quarter last year
- Free Cash Flow Margin: 48.1%, up from 8.3% in the previous quarter
- Market Capitalization: $2.00 billion
Company Overview
Powering the cards behind innovative fintech services like Block's Cash App, Marqeta (NASDAQ: MQ) provides a cloud-based platform that allows businesses to create customized payment card programs and process card transactions.
Revenue Growth
A company’s long-term performance is an indicator of its overall quality. Any business can experience short-term success, but top-performing ones enjoy sustained growth for years. Thankfully, Marqeta’s 19.2% annualized revenue growth over the last five years was decent. Its growth was slightly above the average software company and shows its offerings resonate with customers.
Long-term growth is the most important, but within software, a half-decade historical view may miss new innovations or demand cycles. Marqeta’s recent performance marks a sharp pivot from its five-year trend as its revenue has shown annualized declines of 12.1% over the last two years. 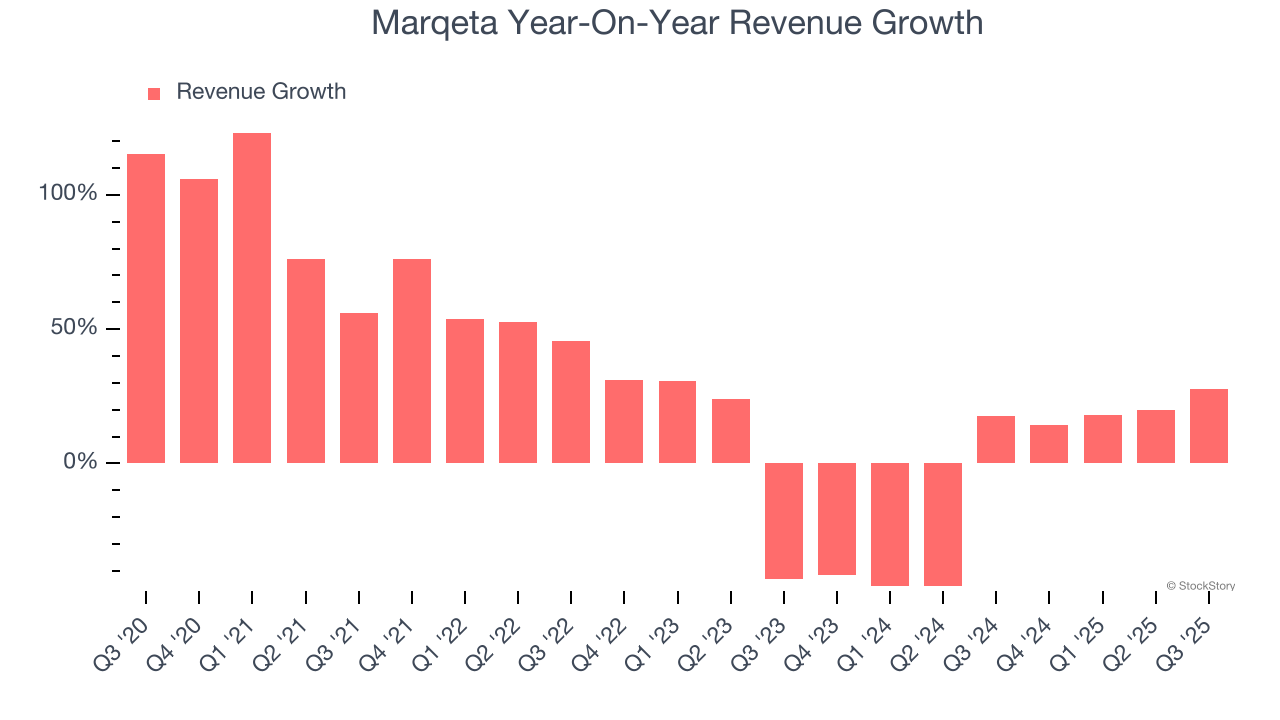
This quarter, Marqeta reported robust year-on-year revenue growth of 27.6%, and its $163.3 million of revenue topped Wall Street estimates by 9.7%. Company management is currently guiding for a 23% year-on-year increase in sales next quarter.
Looking further ahead, sell-side analysts expect revenue to grow 16% over the next 12 months, an improvement versus the last two years. This projection is above average for the sector and implies its newer products and services will spur better top-line performance.
While Wall Street chases Nvidia at all-time highs, an under-the-radar semiconductor supplier is dominating a critical AI component these giants can’t build without. Click here to access our free report one of our favorites growth stories.
Total Payment Volume
TPV, or total processing volume, is the aggregate dollar value of transactions flowing through Marqeta’s platform. This is the number from which the company will ultimately collect fees, and the higher it is, the more chances Marqeta has to upsell additional services (like banking).
Marqeta’s TPV punched in at $97.96 billion in Q3, and over the last four quarters, its growth was fantastic as it averaged 29.4% year-on-year increases. This alternate topline metric grew faster than total sales, which could mean that take rates have declined. However, we can’t automatically assume the company is reducing its fees because take rates can also vary depending on the type of products sold on its platform. 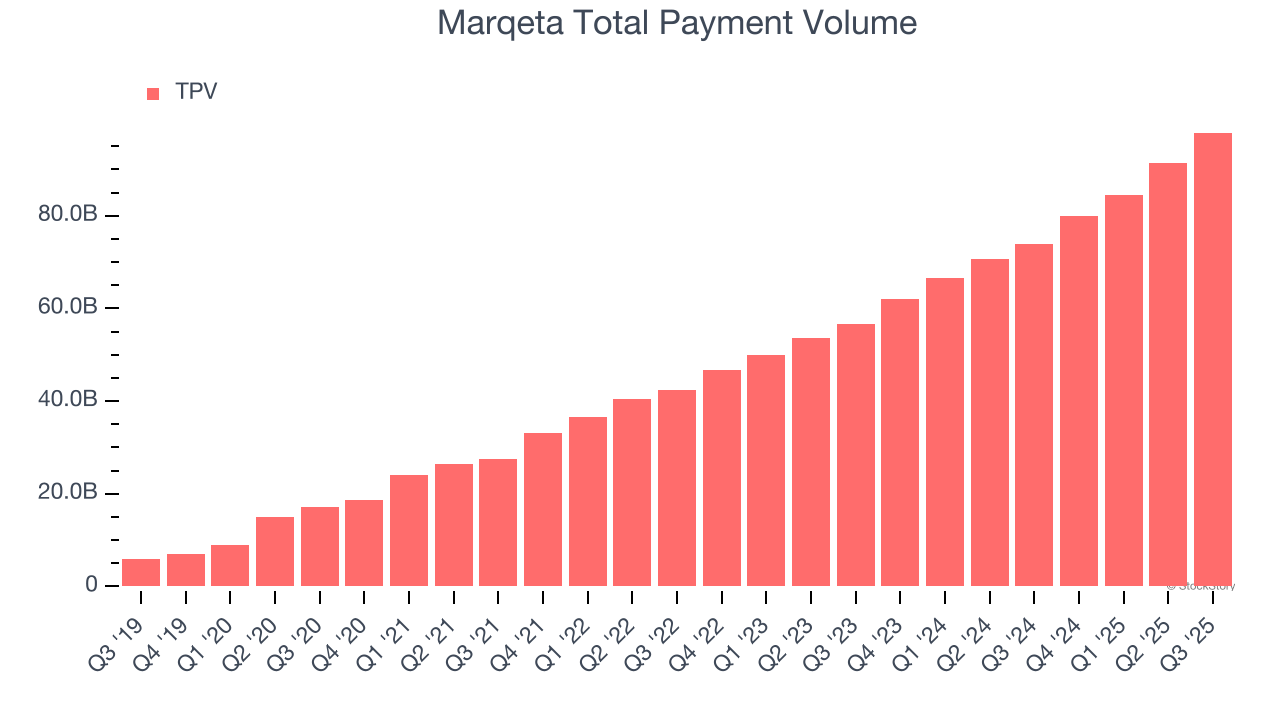
Customer Acquisition Efficiency
The customer acquisition cost (CAC) payback period represents the months required to recover the cost of acquiring a new customer. Essentially, it’s the break-even point for sales and marketing investments. A shorter CAC payback period is ideal, as it implies better returns on investment and business scalability.
Marqeta is extremely efficient at acquiring new customers, and its CAC payback period checked in at 0.6 months this quarter. The company’s rapid recovery of its customer acquisition costs indicates it has a highly differentiated product offering and a strong brand reputation. These dynamics give Marqeta more resources to pursue new product initiatives while maintaining the flexibility to increase its sales and marketing investments.
Key Takeaways from Marqeta’s Q3 Results
We liked that Marqeta's total payment volume outperformed Wall Street’s estimates by a wide margin. Looking ahead, revenue guidance came in ahead of expectations. Zooming out, we think this quarter featured some important positives. The stock traded up 9.1% to $4.90 immediately after reporting.
Marqeta may have had a good quarter, but does that mean you should invest right now? If you’re making that decision, you should consider the bigger picture of valuation, business qualities, as well as the latest earnings. We cover that in our actionable full research report which you can read here, it’s free for active Edge members.