
Quarterly earnings results are a good time to check in on a company’s progress, especially compared to its peers in the same sector. Today we are looking at Interface (NASDAQ: TILE) and the best and worst performers in the office & commercial furniture industry.
The sector faces a tepid outlook as workplace dynamics continue to evolve. Hybrid work means that enterprise demand for office furniture is lower. Consumer demand for the same products likely will not offset the loss from enterprises, as individual workers tend to have less space and need for the sector's wares. The Trump administration also possesses a high willingness to impose tariffs on key partners, which could result in retaliatory actions, all of which could pressure those selling furniture that may feature components or labor from overseas. Lastly, the COVID-19 pandemic showed that there is always a risk that something disrupts supply chains, and companies need contingency plans for this.
The 4 office & commercial furniture stocks we track reported a strong Q3. As a group, revenues beat analysts’ consensus estimates by 2.1% while next quarter’s revenue guidance was in line.
Amidst this news, share prices of the companies have had a rough stretch. On average, they are down 9.6% since the latest earnings results.
Interface (NASDAQ: TILE)
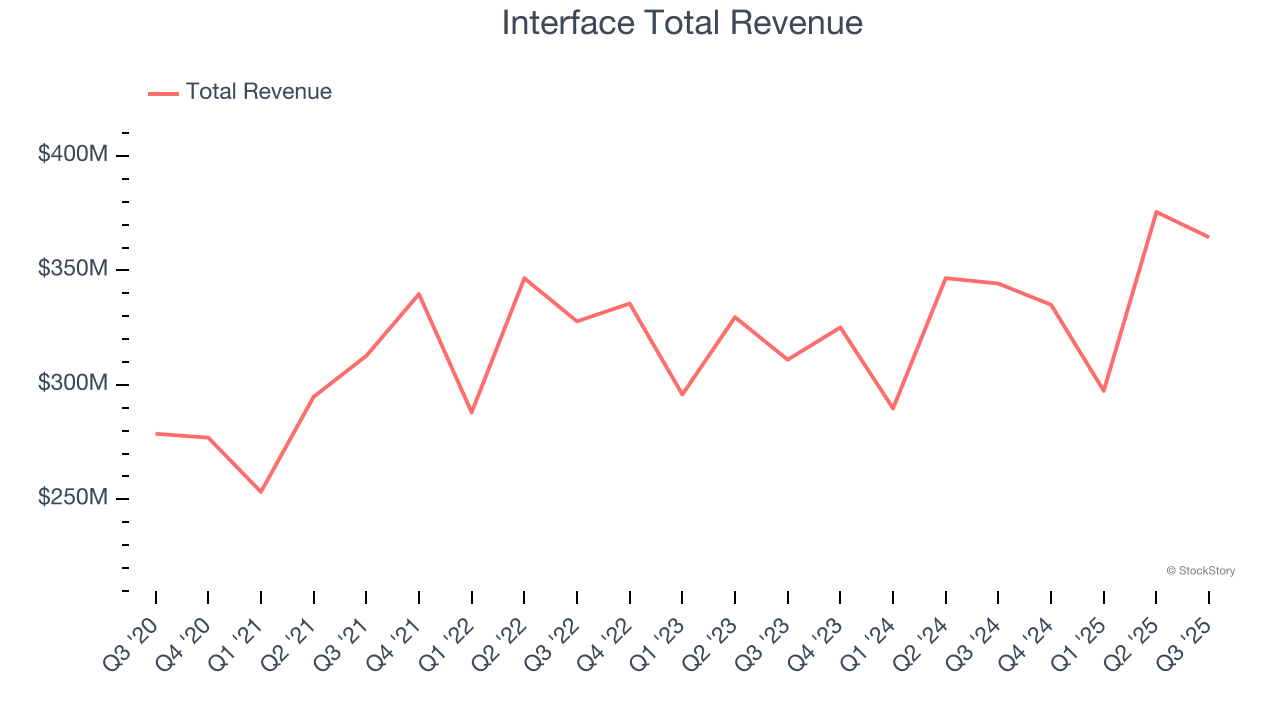
Pioneering carbon-neutral flooring since its founding in 1973, Interface (NASDAQ: TILE) is a global manufacturer of modular carpet tiles, luxury vinyl tile (LVT), and rubber flooring that specializes in carbon-neutral and sustainable flooring solutions.
Interface reported revenues of $364.5 million, up 5.9% year on year. This print exceeded analysts’ expectations by 2%. Overall, it was a very strong quarter for the company with a beat of analysts’ EPS estimates and a solid beat of analysts’ revenue estimates.
“Third quarter results exceeded our expectations, as we delivered another period of strong year-over-year growth and meaningful profitability expansion. Currency-neutral net sales increased 4%, driven by continued share gains in the Americas and increased momentum in EAAA,” commented Laurel Hurd, CEO of Interface.
Unsurprisingly, the stock is down 2.9% since reporting and currently trades at $25.88.
Is now the time to buy Interface? Access our full analysis of the earnings results here, it’s free for active Edge members.
Best Q3: Steelcase (NYSE: SCS)
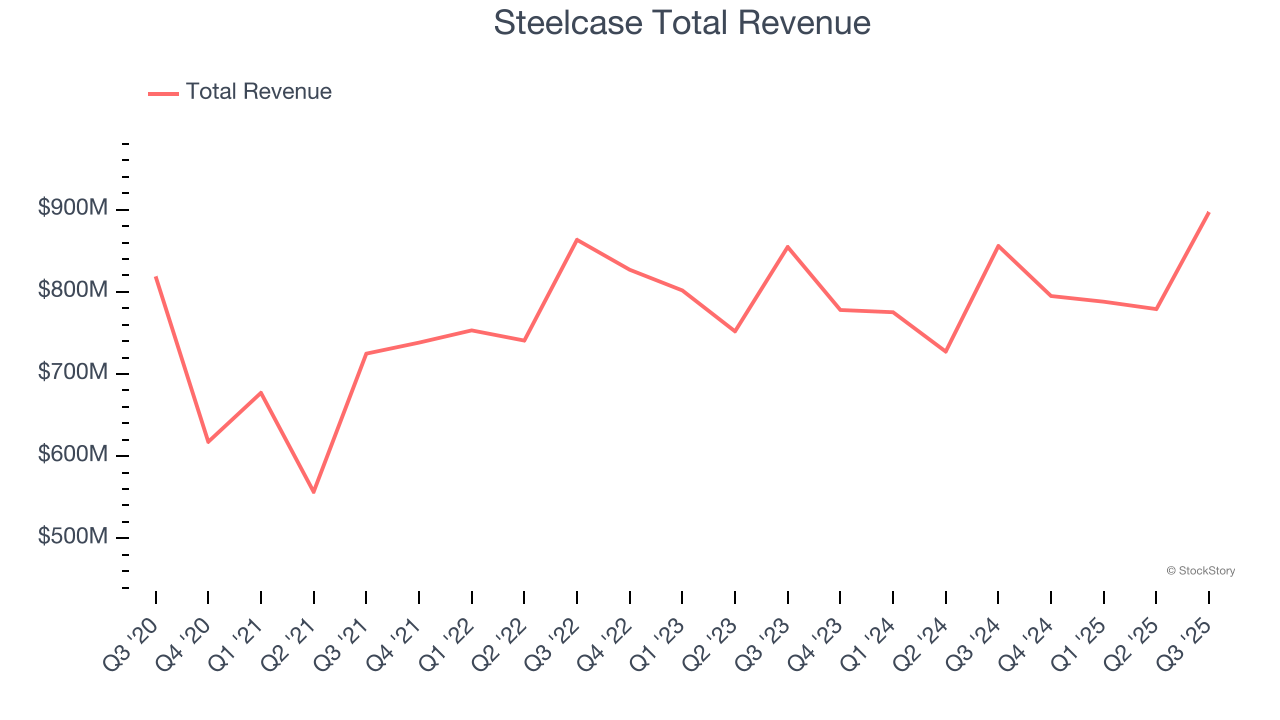
Founded in 1912 when metal office furniture was replacing wooden alternatives, Steelcase (NYSE: SCS) is a global office furniture manufacturer that designs and produces workplace solutions including desks, chairs, architectural products, and services.
Steelcase reported revenues of $897.1 million, up 4.8% year on year, outperforming analysts’ expectations by 2.7%. The business had a stunning quarter with a beat of analysts’ EPS estimates and an impressive beat of analysts’ revenue estimates.
Although it had a fine quarter compared its peers, the market seems unhappy with the results as the stock is down 4.9% since reporting. It currently trades at $15.87.
Is now the time to buy Steelcase? Access our full analysis of the earnings results here, it’s free for active Edge members.
Weakest Q3: HNI (NYSE: HNI)
With roots dating back to 1944 and a significant acquisition of Kimball International in 2023, HNI (NYSE: HNI) manufactures and sells office furniture systems, seating, and storage solutions, as well as residential fireplaces and heating products.
HNI reported revenues of $683.8 million, up 1.7% year on year, falling short of analysts’ expectations by 1.1%. It was a slower quarter as it posted a slight miss of analysts’ revenue estimates.
HNI delivered the weakest performance against analyst estimates and slowest revenue growth in the group. As expected, the stock is down 10.5% since the results and currently trades at $40.22.
Read our full analysis of HNI’s results here.
MillerKnoll (NASDAQ: MLKN)
Created through the 2021 merger of industry icons Herman Miller and Knoll, MillerKnoll (NASDAQ: MLKN) designs, manufactures, and distributes interior furnishings for offices, healthcare facilities, educational settings, and homes worldwide.
MillerKnoll reported revenues of $955.7 million, up 10.9% year on year. This print beat analysts’ expectations by 4.9%. It was a strong quarter as it also produced a beat of analysts’ EPS estimates and a solid beat of analysts’ revenue estimates.
MillerKnoll pulled off the biggest analyst estimates beat and fastest revenue growth among its peers. The stock is down 20.3% since reporting and currently trades at $15.11.
Read our full, actionable report on MillerKnoll here, it’s free for active Edge members.
Market Update
Thanks to the Fed’s series of rate hikes in 2022 and 2023, inflation has cooled significantly from its post-pandemic highs, drawing closer to the 2% goal. This disinflation has occurred without severely impacting economic growth, suggesting the success of a soft landing. The stock market thrived in 2024, spurred by recent rate cuts (0.5% in September and 0.25% in November), and a notable surge followed Donald Trump’s presidential election win in November, propelling indices to historic highs. Nonetheless, the outlook for 2025 remains clouded by potential trade policy changes and corporate tax discussions, which could impact business confidence and growth. The path forward holds both optimism and caution as new policies take shape.
Want to invest in winners with rock-solid fundamentals? Check out our Hidden Gem Stocks and add them to your watchlist. These companies are poised for growth regardless of the political or macroeconomic climate.
StockStory is growing and hiring equity analyst and marketing roles. Are you a 0 to 1 builder passionate about the markets and AI? See the open roles here.