
Cross-border payment platform Payoneer (NASDAQ: PAYO) reported Q3 CY2025 results exceeding the market’s revenue expectations, with sales up 9.1% year on year to $270.9 million. The company’s full-year revenue guidance of $1.06 billion at the midpoint came in 0.9% above analysts’ estimates. Its GAAP profit of $0.04 per share was $0.02 below analysts’ consensus estimates.
Is now the time to buy Payoneer? Find out by accessing our full research report, it’s free for active Edge members.
Payoneer (PAYO) Q3 CY2025 Highlights:
Our mission is straightforward: remove friction between an entrepreneur's ambition and their achievement by delivering a financial stack that is secure, easy to use, and built for global commerce. We are executing against our strategy and have driven over 10 consecutive quarters of year-over-year ARPU and SMB take rate expansion as we move upmarket, increase adoption of multiple products and services, and align our pricing with the value we offer customers. We will continue to navigate short term volatility as our customers adapt their businesses in a dynamic landscape while evolving our business to capture the significant long-term opportunity in front of us, with a clear focus on delivering shareholder returns." John Caplan, Chief Executive Officer
Company Overview
Founded during the early days of global e-commerce in 2005 to solve international payment challenges, Payoneer (NASDAQ: PAYO) provides financial technology services that enable small and medium-sized businesses to send and receive payments globally across borders.
Revenue Growth
Reviewing a company’s long-term sales performance reveals insights into its quality. Any business can put up a good quarter or two, but the best consistently grow over the long haul. Luckily, Payoneer’s revenue grew at an incredible 25.3% compounded annual growth rate over the last five years. Its growth surpassed the average financials company and shows its offerings resonate with customers, a great starting point for our analysis.
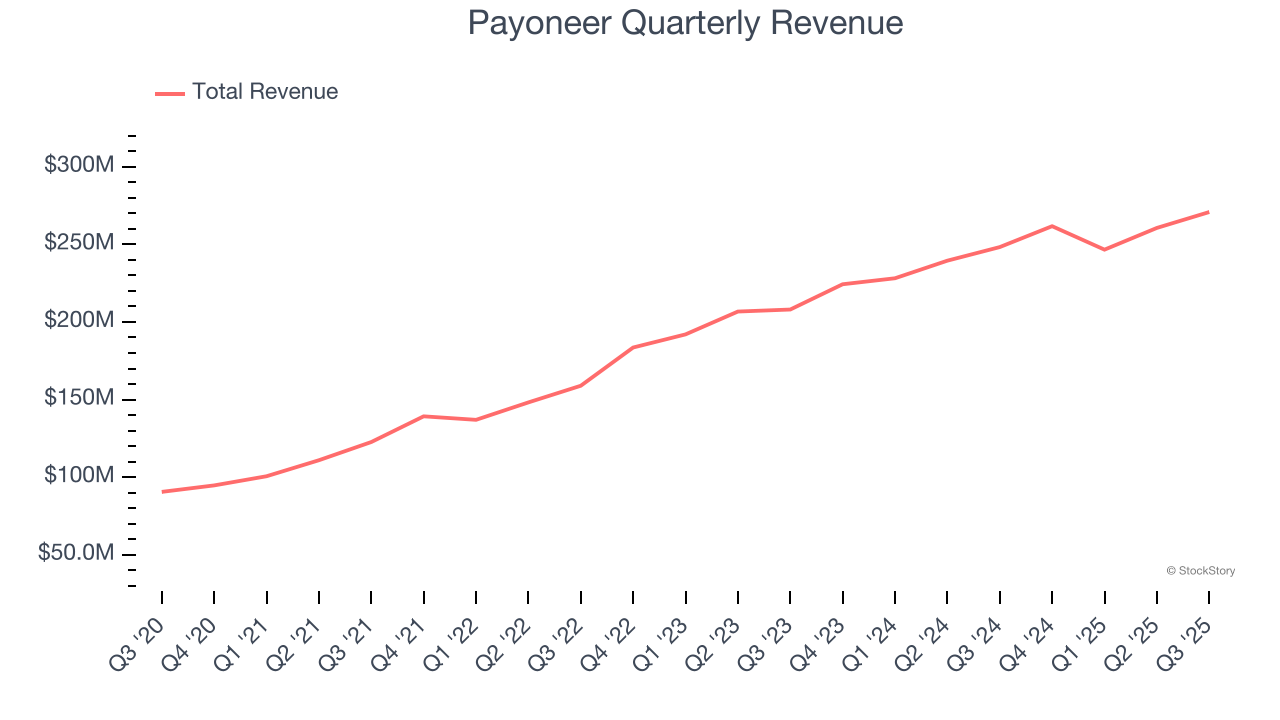
Long-term growth is the most important, but within financials, a half-decade historical view may miss recent interest rate changes and market returns. Payoneer’s annualized revenue growth of 14.7% over the last two years is below its five-year trend, but we still think the results suggest healthy demand. 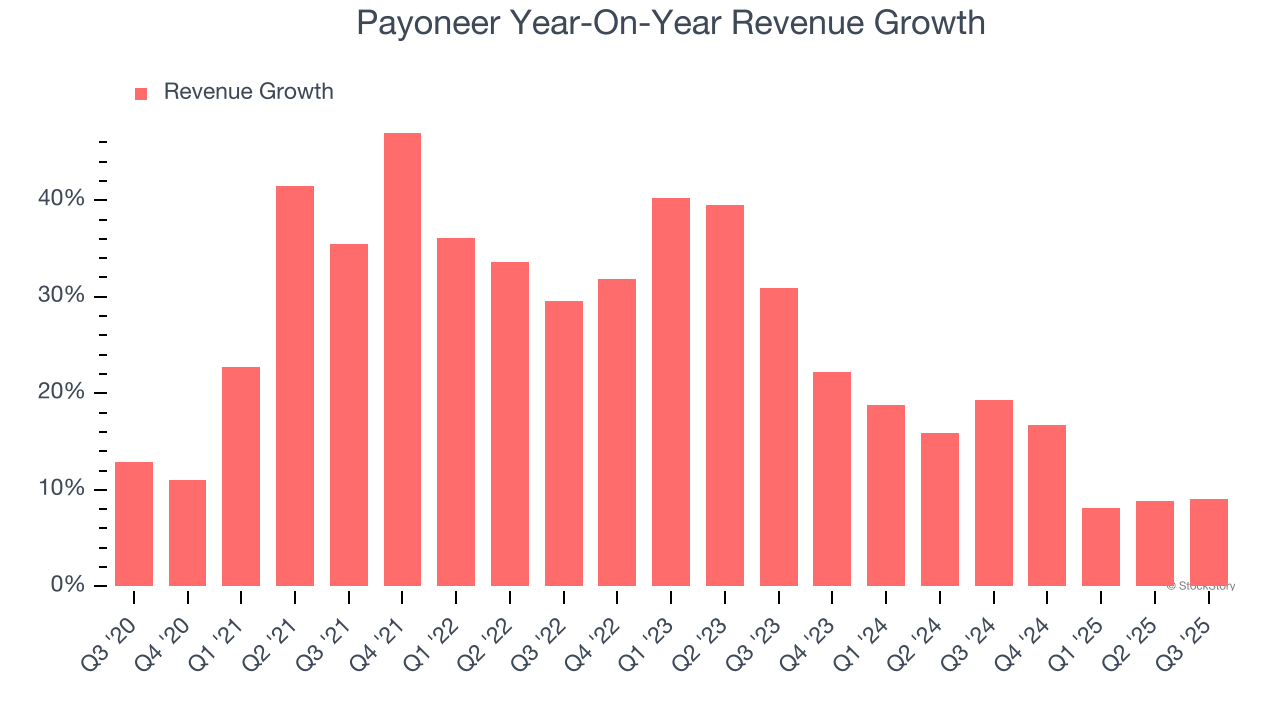
This quarter, Payoneer reported year-on-year revenue growth of 9.1%, and its $270.9 million of revenue exceeded Wall Street’s estimates by 2.9%.
Microsoft, Alphabet, Coca-Cola, Monster Beverage—all began as under-the-radar growth stories riding a massive trend. We’ve identified the next one: a profitable AI semiconductor play Wall Street is still overlooking. Go here for access to our full report.
Key Takeaways from Payoneer’s Q3 Results
It was encouraging to see Payoneer beat analysts’ revenue expectations this quarter. We were also glad its full-year revenue guidance slightly exceeded Wall Street’s estimates. On the other hand, its EPS was in line. Overall, this was a weaker quarter. The stock traded up 4.8% to $6.07 immediately following the results.
Is Payoneer an attractive investment opportunity at the current price? The latest quarter does matter, but not nearly as much as longer-term fundamentals and valuation, when deciding if the stock is a buy. We cover that in our actionable full research report which you can read here, it’s free for active Edge members.