
Hospitality company Pursuit Attractions and Hospitality (NYSE: PRSU) reported Q3 CY2025 results exceeding the market’s revenue expectations, but sales fell by 47.1% year on year to $241 million. Its non-GAAP profit of $2.65 per share was 8% above analysts’ consensus estimates.
Is now the time to buy Pursuit Attractions and Hospitality? Find out by accessing our full research report, it’s free for active Edge members.
Pursuit Attractions and Hospitality (PRSU) Q3 CY2025 Highlights:
- Revenue: $241 million vs analyst estimates of $225 million (47.1% year-on-year decline, 7.1% beat)
- Adjusted EPS: $2.65 vs analyst estimates of $2.45 (8% beat)
- Adjusted EBITDA: $117.4 million vs analyst estimates of $111.4 million (48.7% margin, 5.4% beat)
- EBITDA guidance for the full year is $119 million at the midpoint, above analyst estimates of $114 million
- Operating Margin: 36.5%, up from 18.6% in the same quarter last year
- Market Capitalization: $972.4 million
Company Overview
With attractions ranging from glacier tours in the Canadian Rockies to an oceanfront geothermal lagoon in Iceland, Pursuit Attractions and Hospitality (NYSE: PRSU) operates iconic travel experiences across North America and Europe.
Revenue Growth
A company’s long-term sales performance can indicate its overall quality. Any business can put up a good quarter or two, but many enduring ones grow for years. Over the last five years, Pursuit Attractions and Hospitality’s demand was weak and its revenue declined by 20.2% per year. This was below our standards and is a sign of lacking business quality.
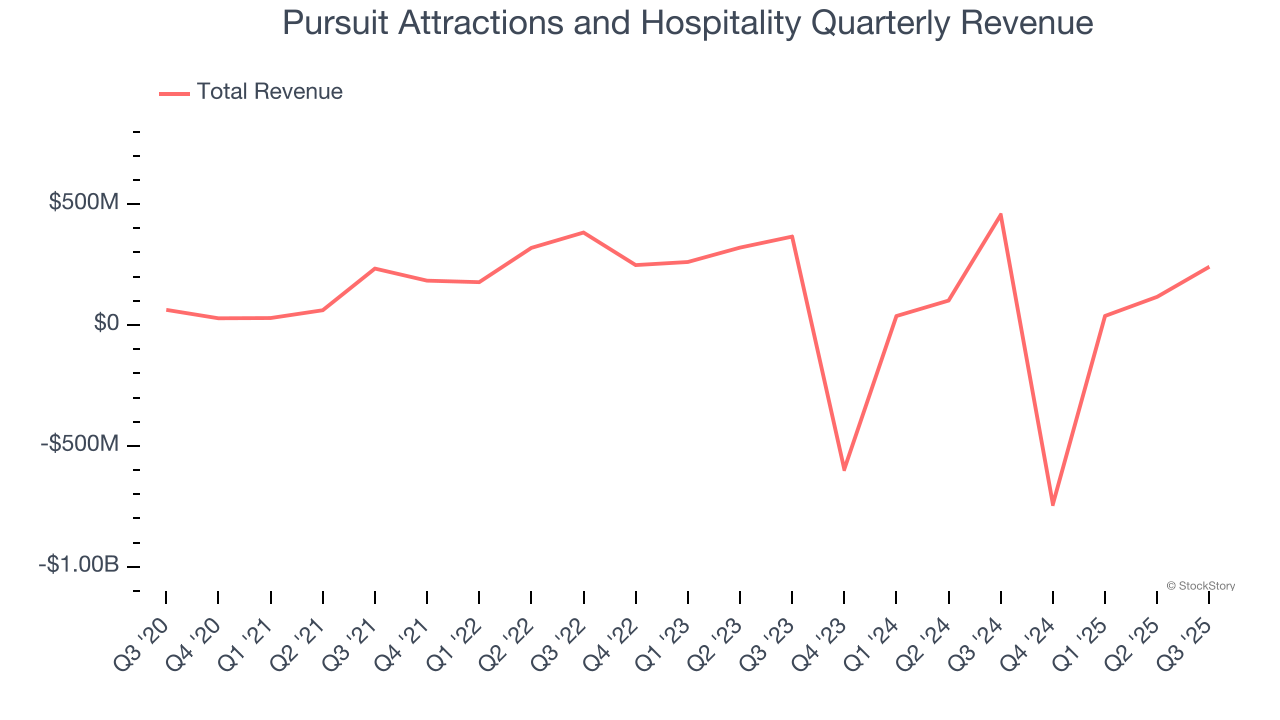
We at StockStory place the most emphasis on long-term growth, but within consumer discretionary, a stretched historical view may miss a company riding a successful new property or trend. Pursuit Attractions and Hospitality’s recent performance shows its demand remained suppressed as its revenue has declined by 51.3% annually over the last two years. 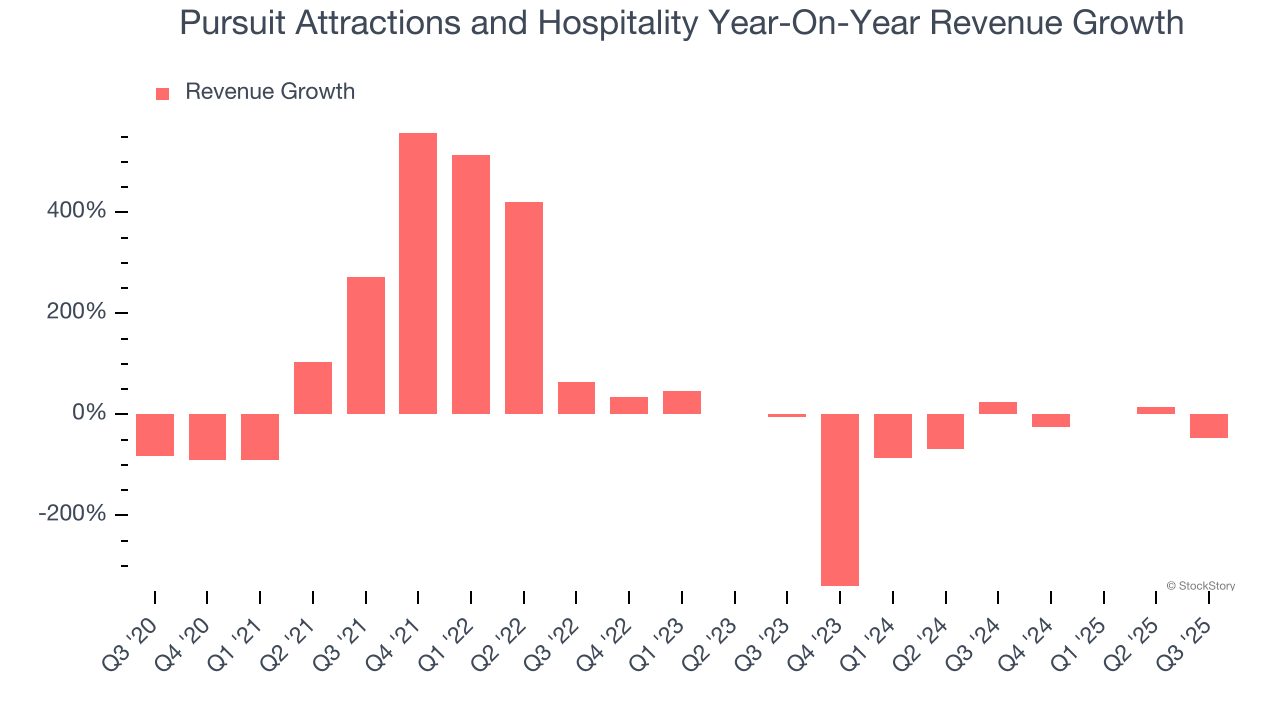
This quarter, Pursuit Attractions and Hospitality’s revenue fell by 47.1% year on year to $241 million but beat Wall Street’s estimates by 7.1%.
Looking ahead, sell-side analysts expect revenue to grow 237% over the next 12 months, an improvement versus the last two years. This projection is eye-popping and suggests its newer products and services will spur better top-line performance.
Software is eating the world and there is virtually no industry left that has been untouched by it. That drives increasing demand for tools helping software developers do their jobs, whether it be monitoring critical cloud infrastructure, integrating audio and video functionality, or ensuring smooth content streaming. Click here to access a free report on our 3 favorite stocks to play this generational megatrend.
Operating Margin
Pursuit Attractions and Hospitality’s operating margin has risen over the last 12 months and averaged 6.3% over the last two years. The company’s higher efficiency is a breath of fresh air, but its suboptimal cost structure means it still sports paltry profitability for a consumer discretionary business.
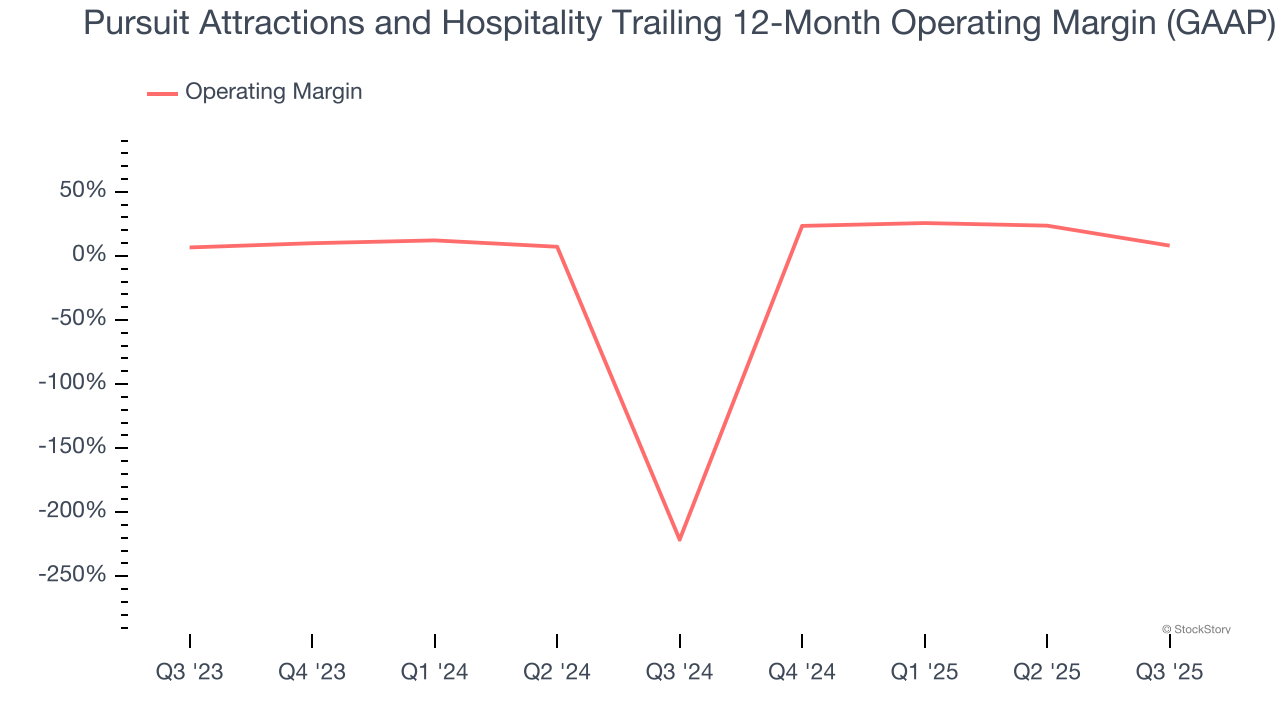
This quarter, Pursuit Attractions and Hospitality generated an operating margin profit margin of 36.5%, up 17.9 percentage points year on year. This increase was a welcome development, especially since its revenue fell, showing it was more efficient because it scaled down its expenses.
Earnings Per Share
Revenue trends explain a company’s historical growth, but the long-term change in earnings per share (EPS) points to the profitability of that growth – for example, a company could inflate its sales through excessive spending on advertising and promotions.
Pursuit Attractions and Hospitality’s full-year EPS flipped from negative to positive over the last five years. This is encouraging and shows it’s at a critical moment in its life.
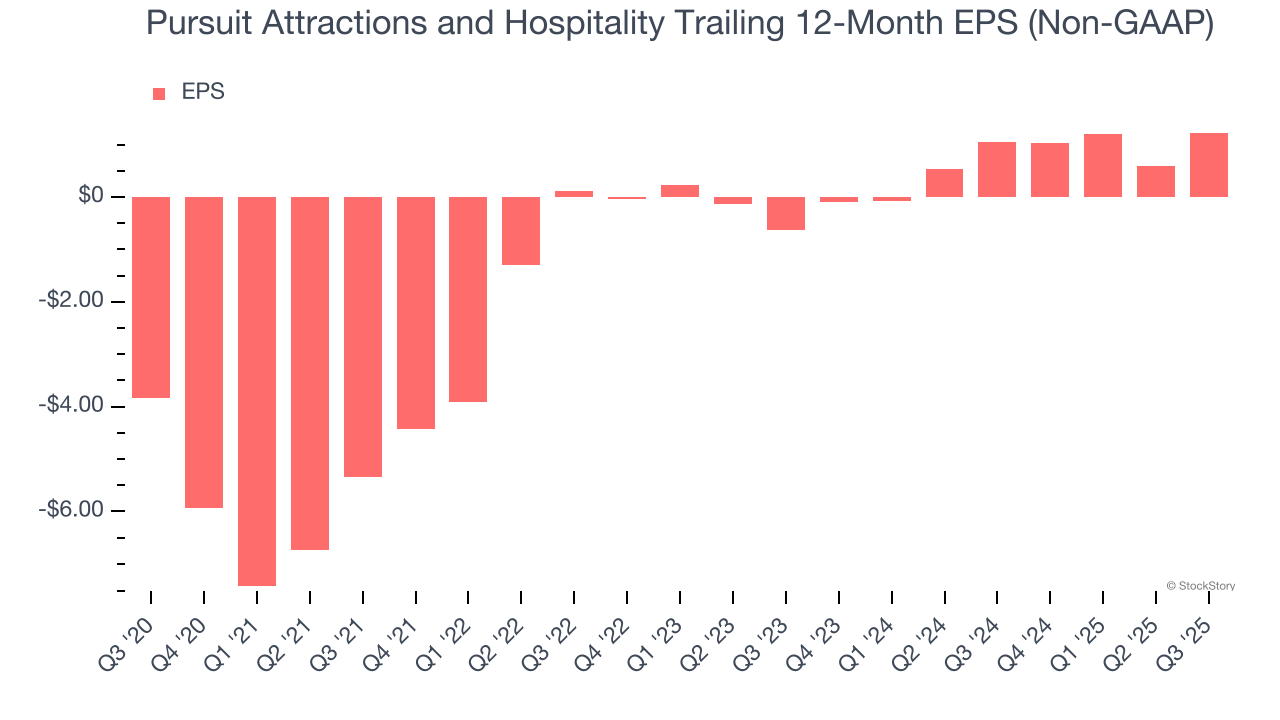
In Q3, Pursuit Attractions and Hospitality reported adjusted EPS of $2.65, up from $2.01 in the same quarter last year. This print beat analysts’ estimates by 8%. Over the next 12 months, Wall Street expects Pursuit Attractions and Hospitality’s full-year EPS of $1.23 to grow 2.4%.
Key Takeaways from Pursuit Attractions and Hospitality’s Q3 Results
We enjoyed seeing Pursuit Attractions and Hospitality beat analysts’ revenue expectations this quarter. We were also glad its full-year EBITDA guidance exceeded Wall Street’s estimates. Overall, we think this was a solid quarter with some key areas of upside. The stock remained flat at $36.41 immediately following the results.
Is Pursuit Attractions and Hospitality an attractive investment opportunity right now? The latest quarter does matter, but not nearly as much as longer-term fundamentals and valuation, when deciding if the stock is a buy. We cover that in our actionable full research report which you can read here, it’s free for active Edge members.


