Home automation and security solutions provider Resideo Technologies (NYSE: REZI) missed Wall Street’s revenue expectations in Q3 CY2025 as sales only rose 2% year on year to $1.86 billion. Next quarter’s revenue guidance of $1.87 billion underwhelmed, coming in 2.3% below analysts’ estimates. Its non-GAAP profit of $0.89 per share was 29% above analysts’ consensus estimates.
Is now the time to buy Resideo? Find out by accessing our full research report, it’s free for active Edge members.
Resideo (REZI) Q3 CY2025 Highlights:
- Revenue: $1.86 billion vs analyst estimates of $1.87 billion (2% year-on-year growth, 0.6% miss)
- Adjusted EPS: $0.89 vs analyst estimates of $0.69 (29% beat)
- Adjusted EBITDA: $229 million vs analyst estimates of $230 million (12.3% margin, in line)
- Revenue Guidance for Q4 CY2025 is $1.87 billion at the midpoint, below analyst estimates of $1.92 billion
- Management lowered its full-year Adjusted EPS guidance to $2.62 at the midpoint, a 6.8% decrease
- EBITDA guidance for the full year is $825 million at the midpoint, in line with analyst expectations
- Operating Margin: 8.3%, up from 6.9% in the same quarter last year
- Free Cash Flow was -$1.60 billion, down from $125 million in the same quarter last year
- Market Capitalization: $6.16 billion
Company Overview
Resideo Technologies, Inc. (NYSE: REZI) is a manufacturer and distributor of technology-driven products and solutions for home comfort, energy management, water management, and safety and security.
Revenue Growth
Examining a company’s long-term performance can provide clues about its quality. Any business can experience short-term success, but top-performing ones enjoy sustained growth for years. Luckily, Resideo’s sales grew at a decent 8.8% compounded annual growth rate over the last five years. Its growth was slightly above the average industrials company and shows its offerings resonate with customers.
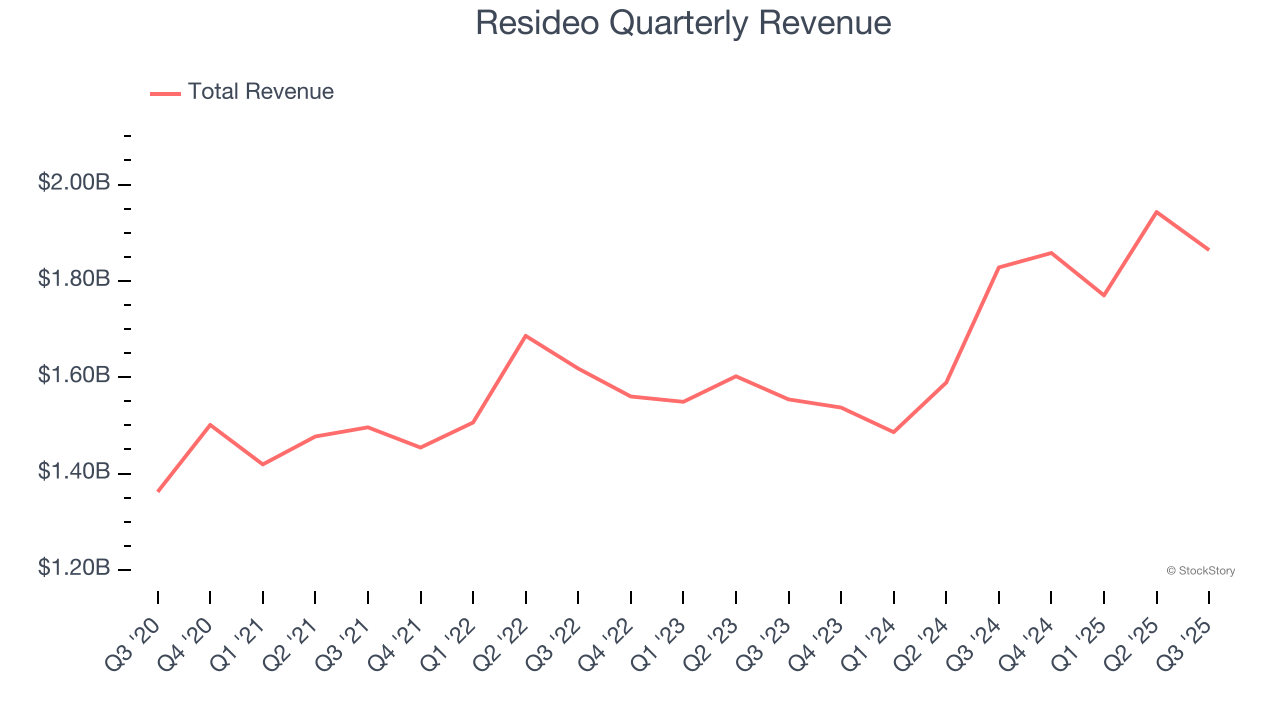
Long-term growth is the most important, but within industrials, a half-decade historical view may miss new industry trends or demand cycles. Resideo’s annualized revenue growth of 8.9% over the last two years aligns with its five-year trend, suggesting its demand was stable. 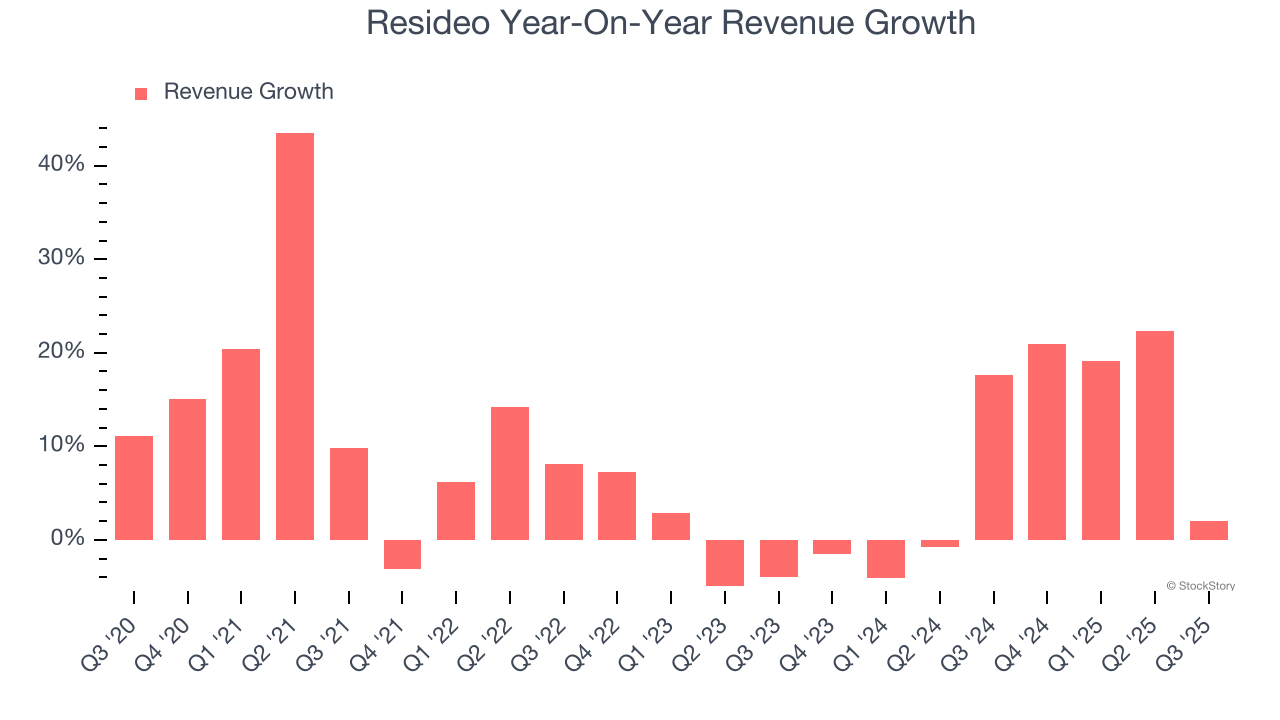
Resideo also breaks out the revenue for its most important segments, ADI Global Distribution and Products & Solutions, which are 64.5% and 35.5% of revenue. Over the last two years, Resideo’s ADI Global Distribution revenue (wholesale distribution of 450k+ products) averaged 16.8% year-on-year growth while its Products & Solutions revenue (branded offerings) was flat. 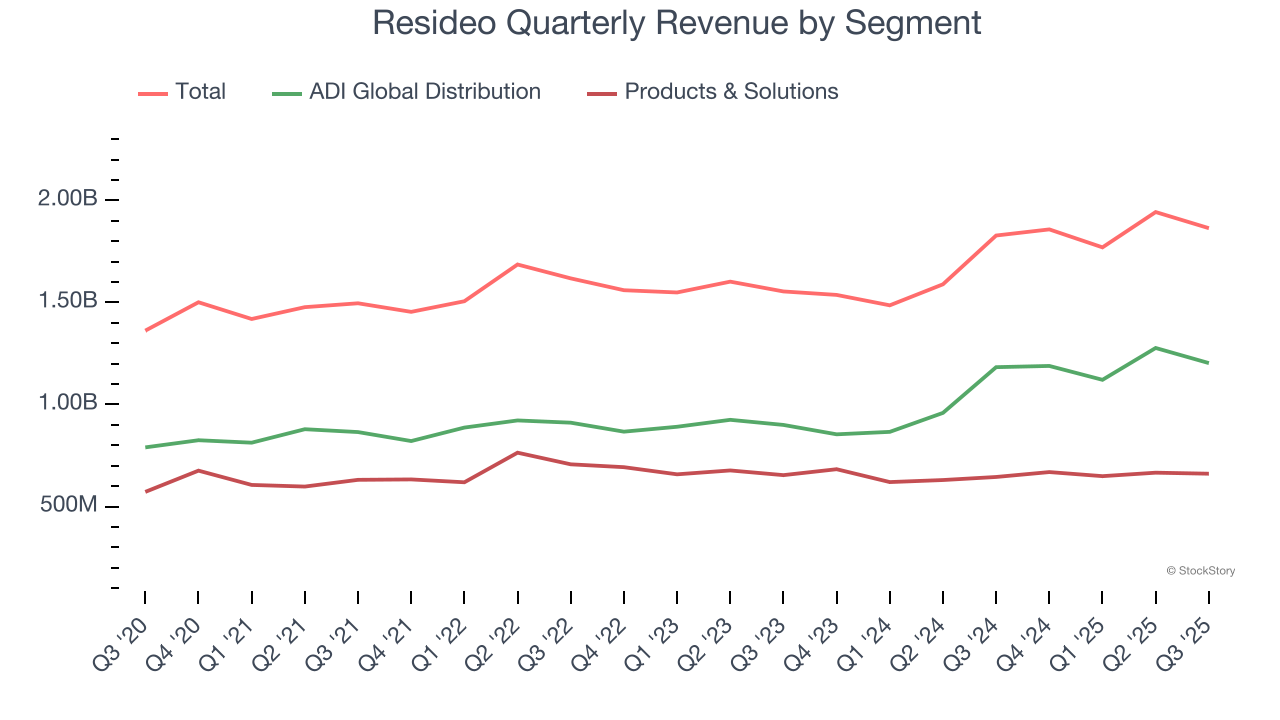
This quarter, Resideo’s revenue grew by 2% year on year to $1.86 billion, falling short of Wall Street’s estimates. Company management is currently guiding for flat sales next quarter.
Looking further ahead, sell-side analysts expect revenue to grow 3.1% over the next 12 months, a deceleration versus the last two years. This projection is underwhelming and suggests its products and services will see some demand headwinds. At least the company is tracking well in other measures of financial health.
Microsoft, Alphabet, Coca-Cola, Monster Beverage—all began as under-the-radar growth stories riding a massive trend. We’ve identified the next one: a profitable AI semiconductor play Wall Street is still overlooking. Go here for access to our full report.
Operating Margin
Resideo has done a decent job managing its cost base over the last five years. The company has produced an average operating margin of 8.8%, higher than the broader industrials sector.
Looking at the trend in its profitability, Resideo’s operating margin decreased by 1.5 percentage points over the last five years. This raises questions about the company’s expense base because its revenue growth should have given it leverage on its fixed costs, resulting in better economies of scale and profitability.
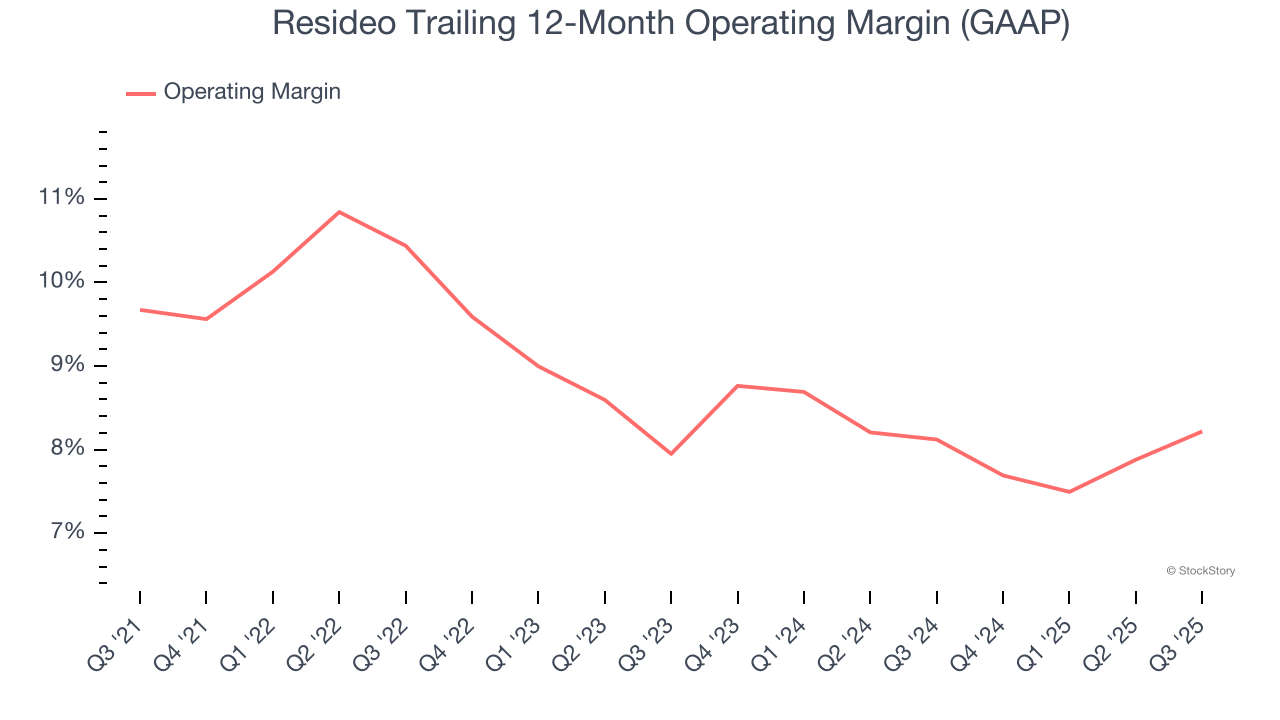
This quarter, Resideo generated an operating margin profit margin of 8.3%, up 1.4 percentage points year on year. The increase was encouraging, and because its operating margin rose more than its gross margin, we can infer it was more efficient with expenses such as marketing, R&D, and administrative overhead.
Earnings Per Share
Revenue trends explain a company’s historical growth, but the long-term change in earnings per share (EPS) points to the profitability of that growth – for example, a company could inflate its sales through excessive spending on advertising and promotions.
Resideo’s unimpressive 7.2% annual EPS growth over the last five years aligns with its revenue performance. This tells us it maintained its per-share profitability as it expanded.
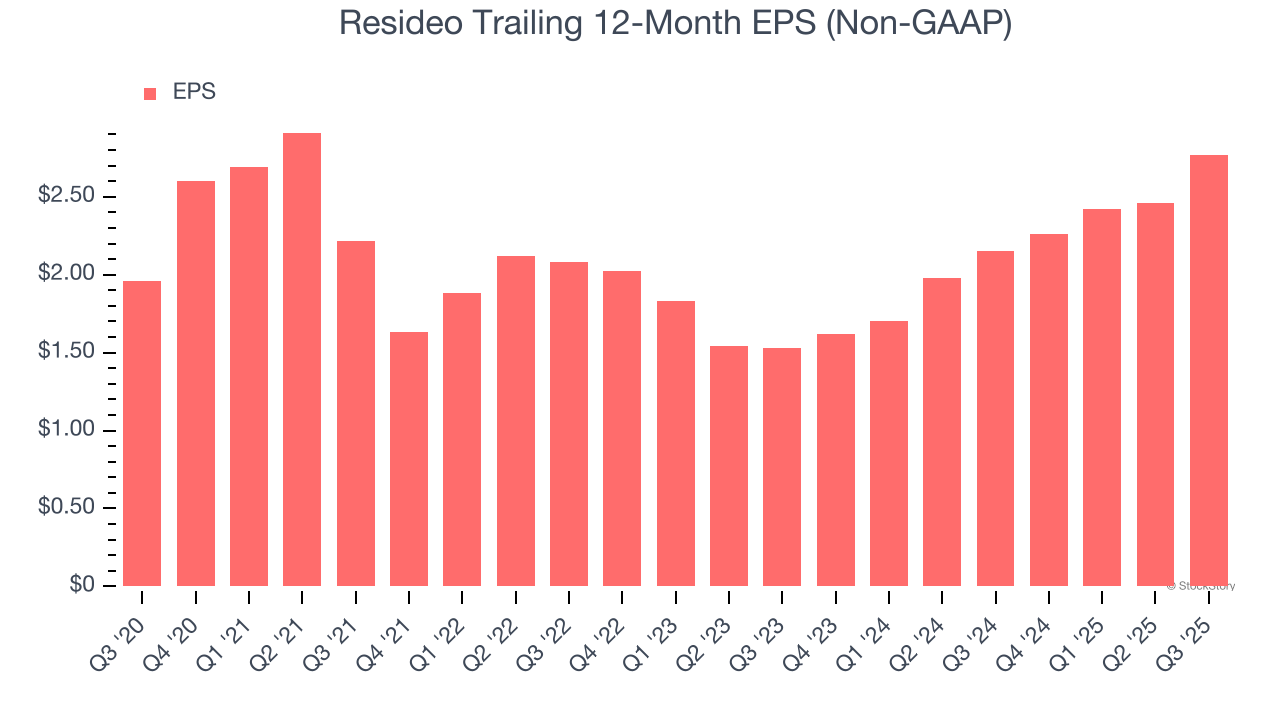
Like with revenue, we analyze EPS over a more recent period because it can provide insight into an emerging theme or development for the business.
Resideo’s two-year annual EPS growth of 34.4% was fantastic and topped its 8.9% two-year revenue growth.
Diving into Resideo’s quality of earnings can give us a better understanding of its performance. Resideo’s operating margin has expanded over the last two years. This was the most relevant factor (aside from the revenue impact) behind its higher earnings; interest expenses and taxes can also affect EPS but don’t tell us as much about a company’s fundamentals.
In Q3, Resideo reported adjusted EPS of $0.89, up from $0.58 in the same quarter last year. This print easily cleared analysts’ estimates, and shareholders should be content with the results. We also like to analyze expected EPS growth based on Wall Street analysts’ consensus projections, but there is insufficient data.
Key Takeaways from Resideo’s Q3 Results
It was good to see Resideo beat analysts’ EPS expectations this quarter. We were also glad its full-year EBITDA guidance was in line with Wall Street’s estimates. On the other hand, its EBITDA guidance for next quarter missed and its Products & Solutions revenue fell short of Wall Street’s estimates. Overall, this quarter could have been better. The stock traded down 19.6% to $32.97 immediately following the results.
Is Resideo an attractive investment opportunity at the current price? What happened in the latest quarter matters, but not as much as longer-term business quality and valuation, when deciding whether to invest in this stock. We cover that in our actionable full research report which you can read here, it’s free for active Edge members.