Travel technology company Sabre (NASDAQ: SABR) announced better-than-expected revenue in Q3 CY2025, with sales up 3.5% year on year to $715.2 million. On the other hand, next quarter’s revenue guidance of $644.9 million was less impressive, coming in 3.5% below analysts’ estimates. Its GAAP profit of $1.98 per share was significantly above analysts’ consensus estimates.
Is now the time to buy Sabre? Find out by accessing our full research report, it’s free for active Edge members.
Sabre (SABR) Q3 CY2025 Highlights:
- Revenue: $715.2 million vs analyst estimates of $706.4 million (3.5% year-on-year growth, 1.2% beat)
- EPS (GAAP): $1.98 vs analyst estimates of -$0.01 (significant beat)
- Adjusted EBITDA: $140.6 million vs analyst estimates of $144.2 million (19.7% margin, 2.5% miss)
- Revenue Guidance for Q4 CY2025 is $644.9 million at the midpoint, below analyst estimates of $668.3 million
- EBITDA guidance for the full year is $530 million at the midpoint, below analyst estimates of $542.8 million
- Operating Margin: 13.1%, up from 10.1% in the same quarter last year
- Free Cash Flow Margin: 1.9%, similar to the same quarter last year
- Total Bookings: 95.14 million, up 2.34 million year on year
- Market Capitalization: $789 million
Company Overview
Originally a division of American Airlines, Sabre (NASDAQ: SABR) is a technology provider for the global travel and tourism industry.
Revenue Growth
A company’s long-term sales performance is one signal of its overall quality. Any business can put up a good quarter or two, but many enduring ones grow for years. Unfortunately, Sabre’s 7.6% annualized revenue growth over the last five years was sluggish. This was below our standard for the consumer discretionary sector and is a tough starting point for our analysis.
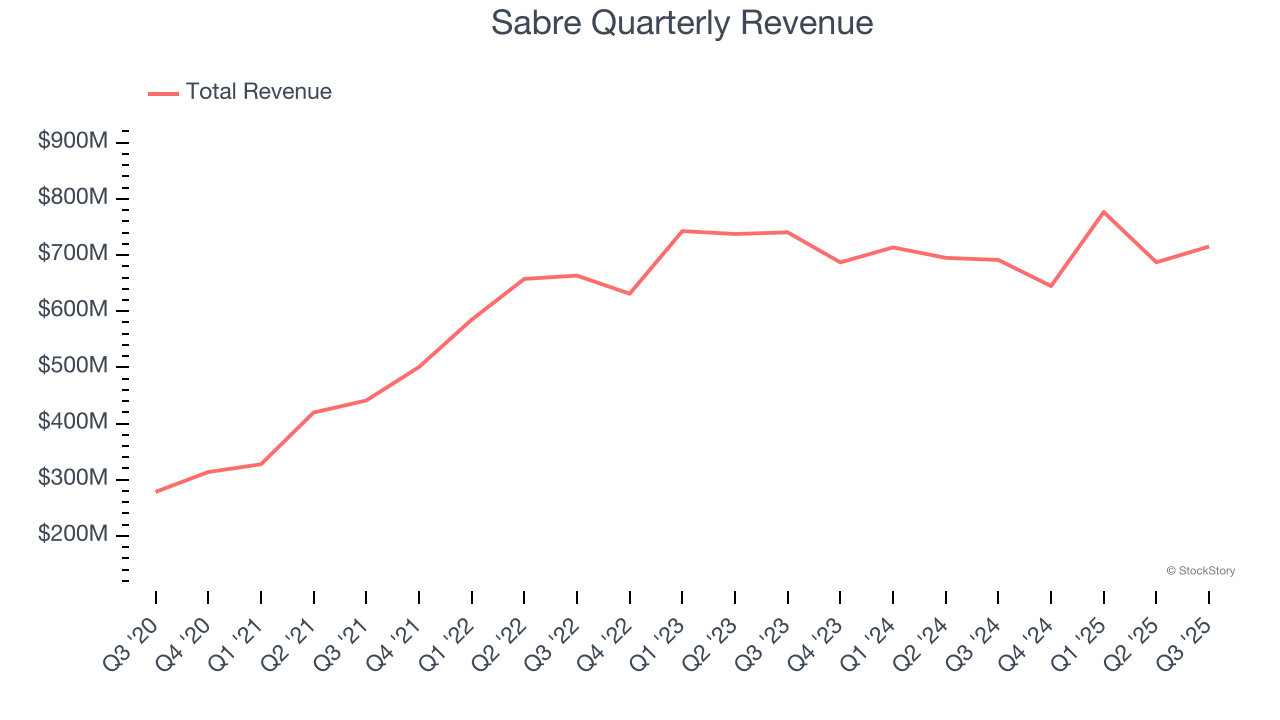
We at StockStory place the most emphasis on long-term growth, but within consumer discretionary, a stretched historical view may miss a company riding a successful new property or trend. Sabre’s recent performance shows its demand has slowed as its revenue was flat over the last two years. 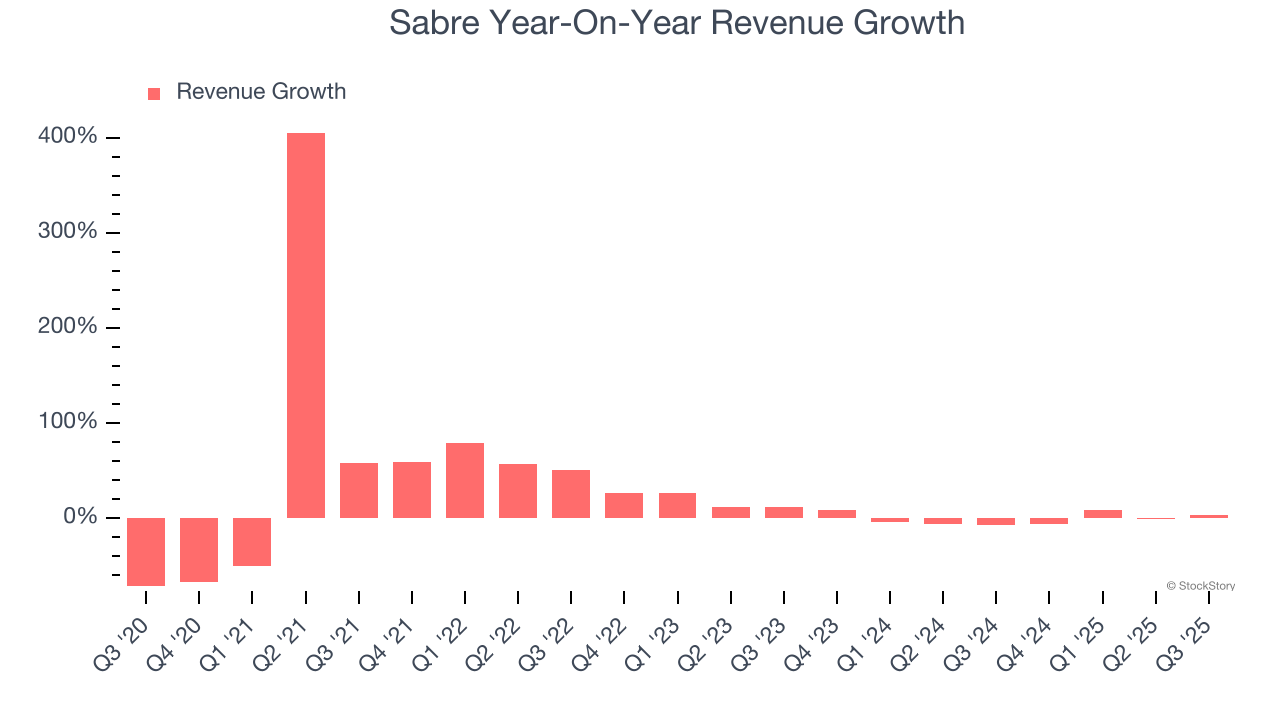
We can dig further into the company’s revenue dynamics by analyzing its number of total bookings, which reached 95.14 million in the latest quarter. Over the last two years, Sabre’s total bookings averaged 1.5% year-on-year growth. Because this number is higher than its revenue growth during the same period, we can see the company’s monetization has fallen. 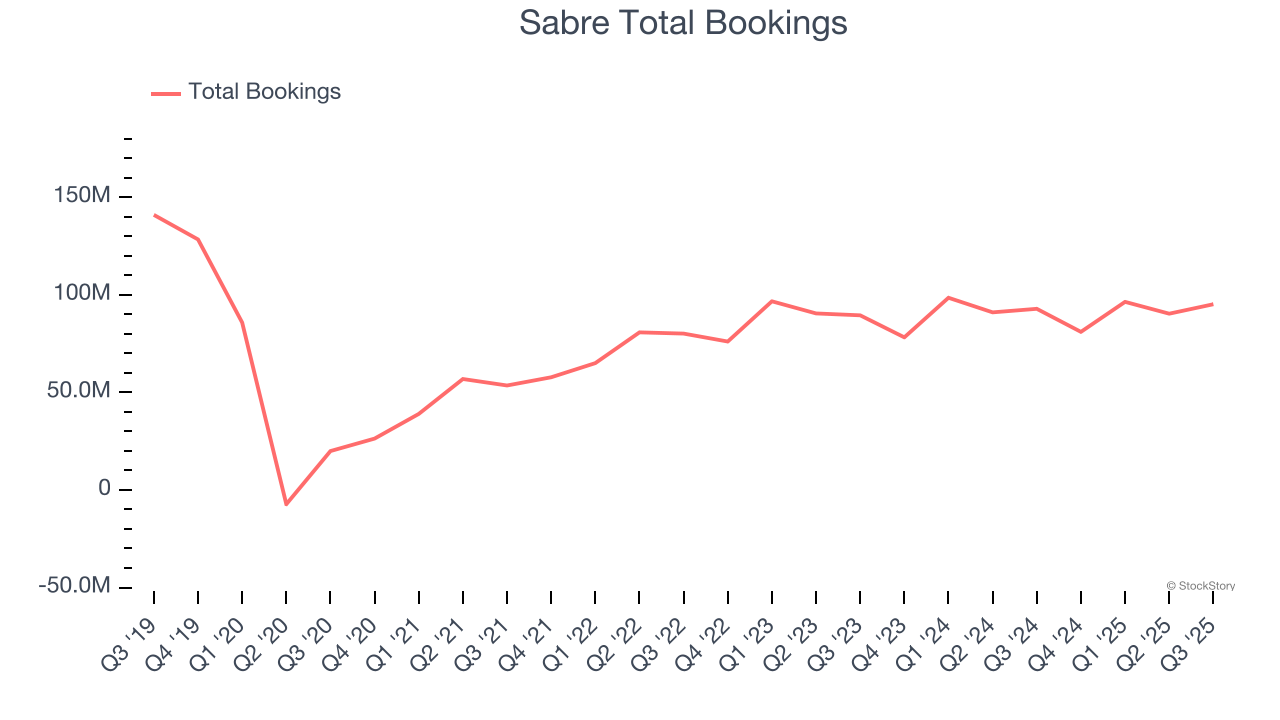
This quarter, Sabre reported modest year-on-year revenue growth of 3.5% but beat Wall Street’s estimates by 1.2%. Company management is currently guiding for flat sales next quarter.
Looking further ahead, sell-side analysts expect revenue to grow 1.3% over the next 12 months. While this projection implies its newer products and services will spur better top-line performance, it is still below the sector average.
Microsoft, Alphabet, Coca-Cola, Monster Beverage—all began as under-the-radar growth stories riding a massive trend. We’ve identified the next one: a profitable AI semiconductor play Wall Street is still overlooking. Go here for access to our full report.
Operating Margin
Operating margin is a key measure of profitability. Think of it as net income - the bottom line - excluding the impact of taxes and interest on debt, which are less connected to business fundamentals.
Sabre’s operating margin has been trending up over the last 12 months and averaged 10.6% over the last two years. Its profitability was higher than the broader consumer discretionary sector, showing it did a decent job managing its expenses.
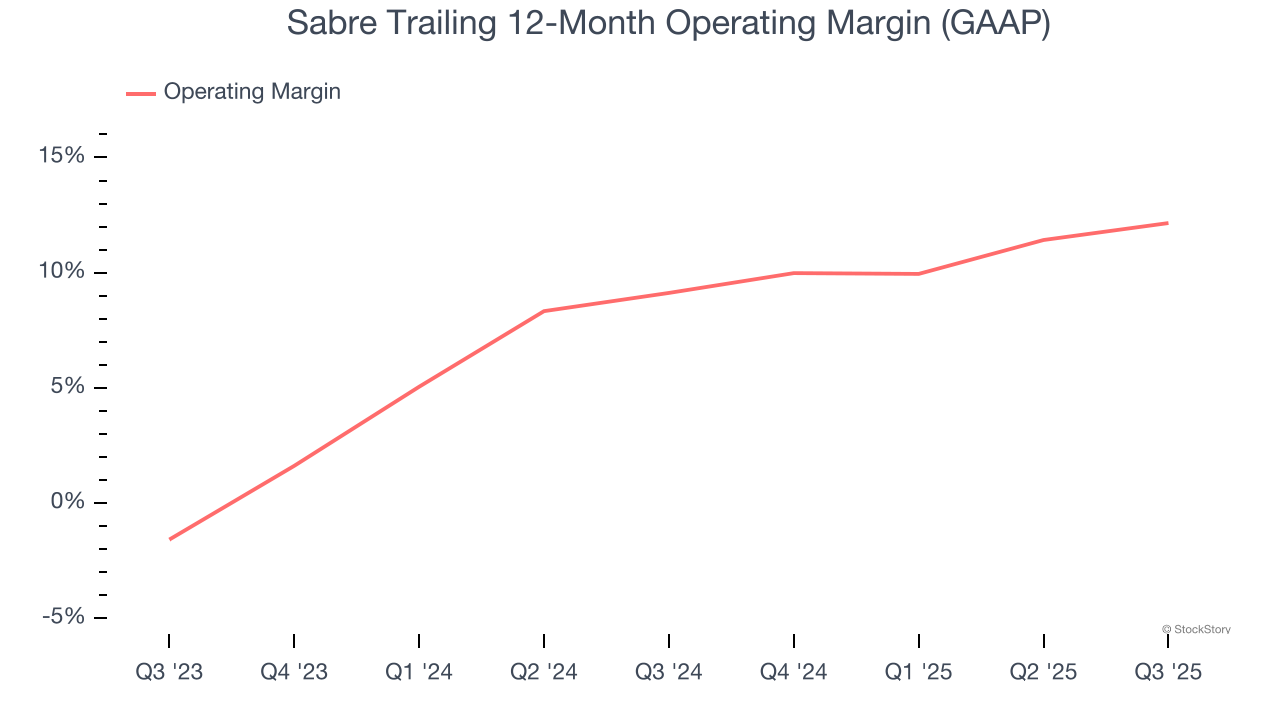
In Q3, Sabre generated an operating margin profit margin of 13.1%, up 2.9 percentage points year on year. This increase was a welcome development and shows it was more efficient.
Earnings Per Share
We track the long-term change in earnings per share (EPS) for the same reason as long-term revenue growth. Compared to revenue, however, EPS highlights whether a company’s growth is profitable.
Sabre’s full-year EPS flipped from negative to positive over the last five years. This is encouraging and shows it’s at a critical moment in its life.
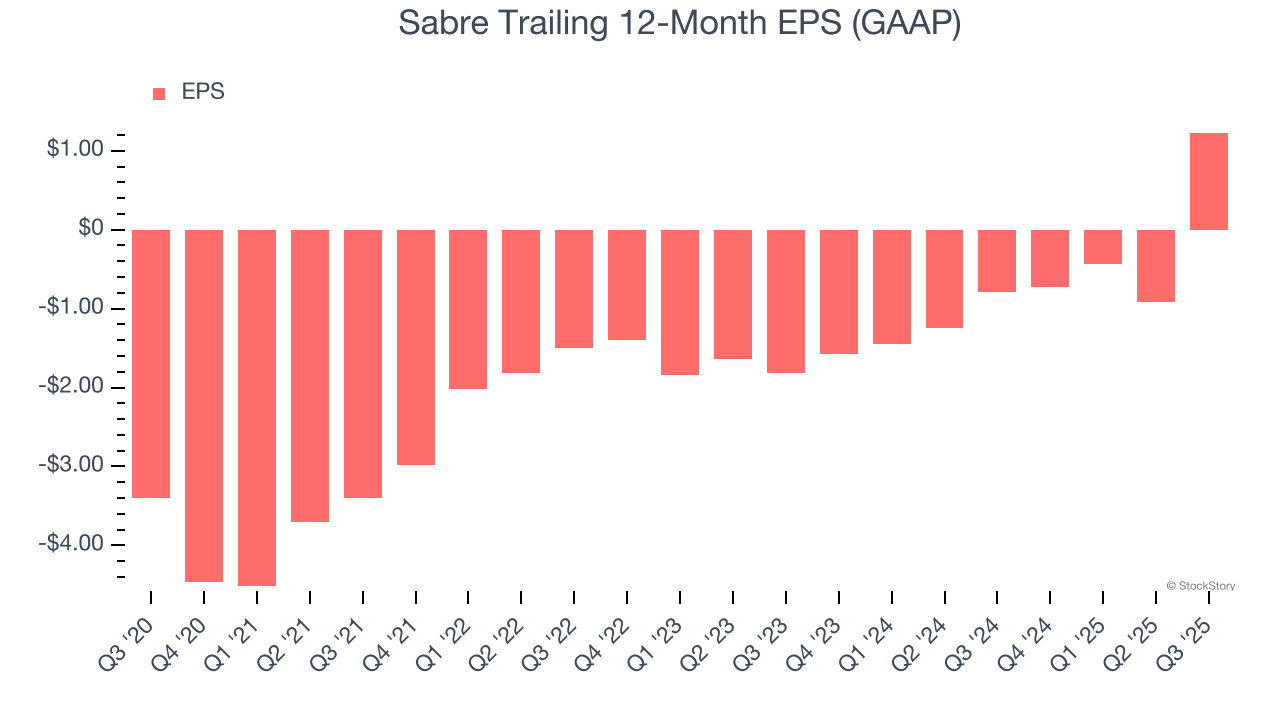
In Q3, Sabre reported EPS of $1.98, up from negative $0.16 in the same quarter last year. This print easily cleared analysts’ estimates, and shareholders should be content with the results. Over the next 12 months, Wall Street expects Sabre’s full-year EPS of $1.23 to shrink by 88.3%.
Key Takeaways from Sabre’s Q3 Results
It was good to see Sabre beat analysts’ EPS expectations this quarter. We were also happy its revenue narrowly outperformed Wall Street’s estimates. On the other hand, its EBITDA guidance for next quarter missed and its number of total bookings fell short of Wall Street’s estimates. Overall, this quarter could have been better. The stock traded down 10.4% to $1.80 immediately following the results.
The latest quarter from Sabre’s wasn’t that good. One earnings report doesn’t define a company’s quality, though, so let’s explore whether the stock is a buy at the current price. When making that decision, it’s important to consider its valuation, business qualities, as well as what has happened in the latest quarter. We cover that in our actionable full research report which you can read here, it’s free for active Edge members.


