Audio technology Sonos company (NASDAQ: SONO) reported Q3 CY2025 results topping the market’s revenue expectations, with sales up 12.7% year on year to $287.9 million. Its GAAP loss of $0.31 per share was 29.2% below analysts’ consensus estimates.
Is now the time to buy Sonos? Find out by accessing our full research report, it’s free for active Edge members.
Sonos (SONO) Q3 CY2025 Highlights:
- Revenue: $287.9 million vs analyst estimates of $278.2 million (12.7% year-on-year growth, 3.5% beat)
- EPS (GAAP): -$0.31 vs analyst expectations of -$0.24 (29.2% miss)
- Adjusted EBITDA: $6.36 million vs analyst estimates of $2.62 million (2.2% margin, significant beat)
- Operating Margin: -12%, up from -27.2% in the same quarter last year
- Free Cash Flow was -$2.34 million compared to -$53.5 million in the same quarter last year
- Market Capitalization: $1.98 billion
“Q4 marked a strong finish to a transitional year for Sonos,” said Tom Conrad, Chief Executive Officer of Sonos.
Company Overview
A pioneer in connected home audio systems, Sonos (NASDAQ: SONO) offers a range of premium wireless speakers and sound systems.
Revenue Growth
Reviewing a company’s long-term sales performance reveals insights into its quality. Any business can put up a good quarter or two, but many enduring ones grow for years. Unfortunately, Sonos’s 1.7% annualized revenue growth over the last five years was weak. This was below our standards and is a poor baseline for our analysis.
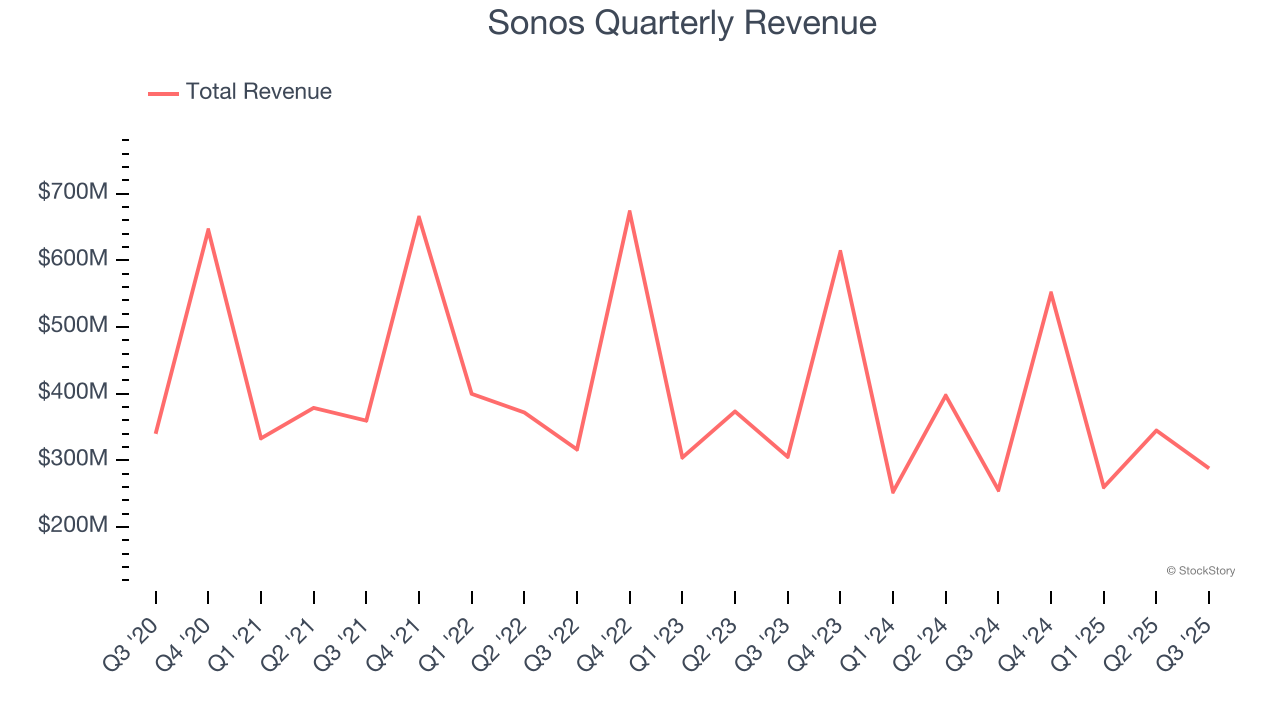
Long-term growth is the most important, but within consumer discretionary, product cycles are short and revenue can be hit-driven due to rapidly changing trends and consumer preferences. Sonos’s performance shows it grew in the past but relinquished its gains over the last two years, as its revenue fell by 6.6% annually. 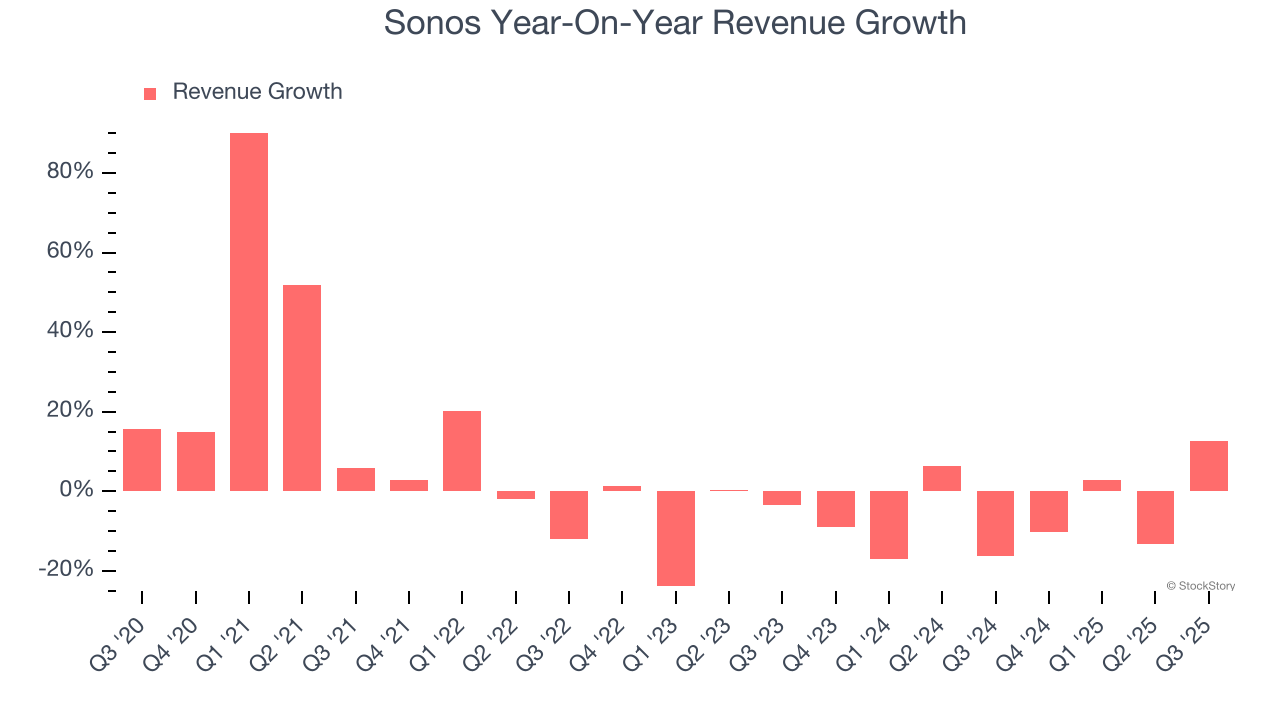
This quarter, Sonos reported year-on-year revenue growth of 12.7%, and its $287.9 million of revenue exceeded Wall Street’s estimates by 3.5%.
Looking ahead, sell-side analysts expect revenue to remain flat over the next 12 months. Although this projection implies its newer products and services will spur better top-line performance, it is still below the sector average.
Software is eating the world and there is virtually no industry left that has been untouched by it. That drives increasing demand for tools helping software developers do their jobs, whether it be monitoring critical cloud infrastructure, integrating audio and video functionality, or ensuring smooth content streaming. Click here to access a free report on our 3 favorite stocks to play this generational megatrend.
Operating Margin
Sonos’s operating margin might fluctuated slightly over the last 12 months but has generally stayed the same, averaging negative 3.3% over the last two years. Unprofitable consumer discretionary companies that fail to improve their losses or grow sales rapidly deserve extra scrutiny. For the time being, it’s unclear if Sonos’s business model is sustainable.

In Q3, Sonos generated a negative 12% operating margin. The company's consistent lack of profits raise a flag.
Earnings Per Share
We track the long-term change in earnings per share (EPS) for the same reason as long-term revenue growth. Compared to revenue, however, EPS highlights whether a company’s growth is profitable.
Sonos’s earnings losses deepened over the last five years as its EPS dropped 15.8% annually. We tend to steer our readers away from companies with falling EPS, where diminishing earnings could imply changing secular trends and preferences. Consumer Discretionary companies are particularly exposed to this, and if the tide turns unexpectedly, Sonos’s low margin of safety could leave its stock price susceptible to large downswings.
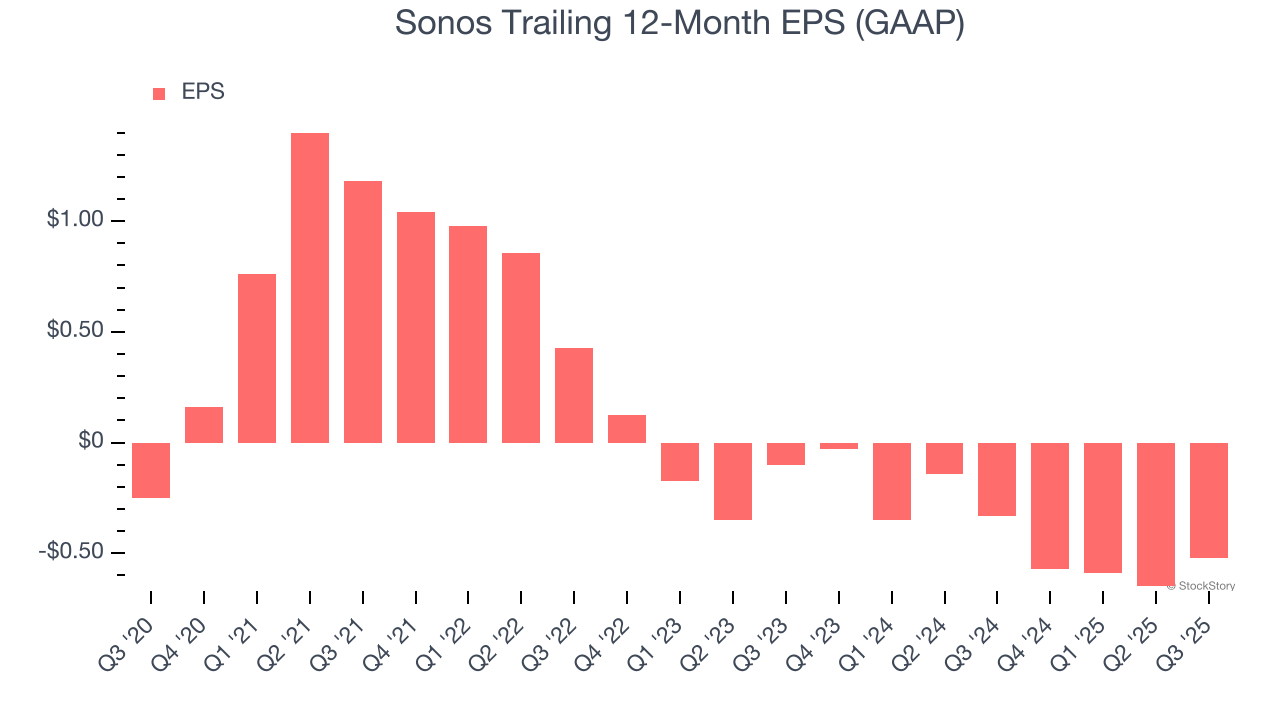
In Q3, Sonos reported EPS of negative $0.31, up from negative $0.44 in the same quarter last year. Despite growing year on year, this print missed analysts’ estimates. Over the next 12 months, Wall Street expects Sonos to improve its earnings losses. Analysts forecast its full-year EPS of negative $0.52 will advance to negative $0.25.
Key Takeaways from Sonos’s Q3 Results
We were impressed by how significantly Sonos blew past analysts’ EBITDA expectations this quarter. We were also happy its revenue outperformed Wall Street’s estimates. On the other hand, its EPS missed. Overall, this print had some key positives. Investors were likely hoping for more, and shares traded down 8.5% to $14.99 immediately after reporting.
Is Sonos an attractive investment opportunity at the current price? The latest quarter does matter, but not nearly as much as longer-term fundamentals and valuation, when deciding if the stock is a buy. We cover that in our actionable full research report which you can read here, it’s free for active Edge members.