
Social media management platform Sprout Social (NASDAQ: SPT) announced better-than-expected revenue in Q3 CY2025, with sales up 12.6% year on year to $115.6 million. The company expects next quarter’s revenue to be around $118.6 million, close to analysts’ estimates. Its non-GAAP profit of $0.23 per share was 43.8% above analysts’ consensus estimates.
Is now the time to buy Sprout Social? Find out by accessing our full research report, it’s free for active Edge members.
Sprout Social (SPT) Q3 CY2025 Highlights:
- Revenue: $115.6 million vs analyst estimates of $114.9 million (12.6% year-on-year growth, 0.6% beat)
- Adjusted EPS: $0.23 vs analyst estimates of $0.16 (43.8% beat)
- Adjusted Operating Income: $13.73 million vs analyst estimates of $9.87 million (11.9% margin, 39.1% beat)
- Revenue Guidance for Q4 CY2025 is $118.6 million at the midpoint, roughly in line with what analysts were expecting
- Management raised its full-year Adjusted EPS guidance to $0.78 at the midpoint, a 6.8% increase
- Operating Margin: -7.9%, up from -16.4% in the same quarter last year
- Free Cash Flow Margin: 8.9%, up from 3.7% in the previous quarter
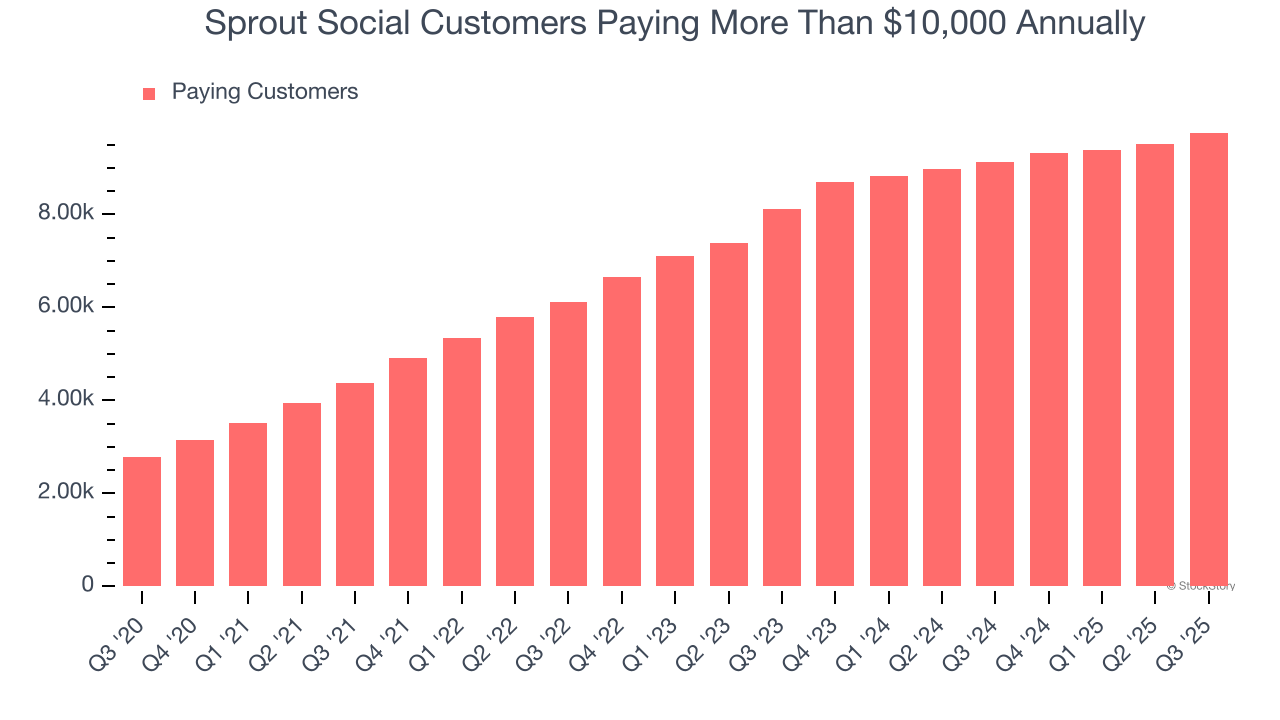
- Customers: 9,756 customers paying more than $10,000 annually
- Billings: $114.1 million at quarter end, up 10.1% year on year
- Market Capitalization: $600.5 million
“Our team delivered strong results in the third quarter, highlighted by 17% cRPO growth and strong profitability,” said Ryan Barretto, CEO of Sprout Social.
Company Overview
Born from the recognition that businesses needed a centralized way to handle their growing social media presence, Sprout Social (NASDAQ: SPT) provides a comprehensive software platform that helps businesses manage, analyze, and optimize their presence across various social media networks.
Revenue Growth
A company’s long-term sales performance can indicate its overall quality. Any business can have short-term success, but a top-tier one grows for years. Thankfully, Sprout Social’s 29.1% annualized revenue growth over the last five years was impressive. Its growth beat the average software company and shows its offerings resonate with customers.
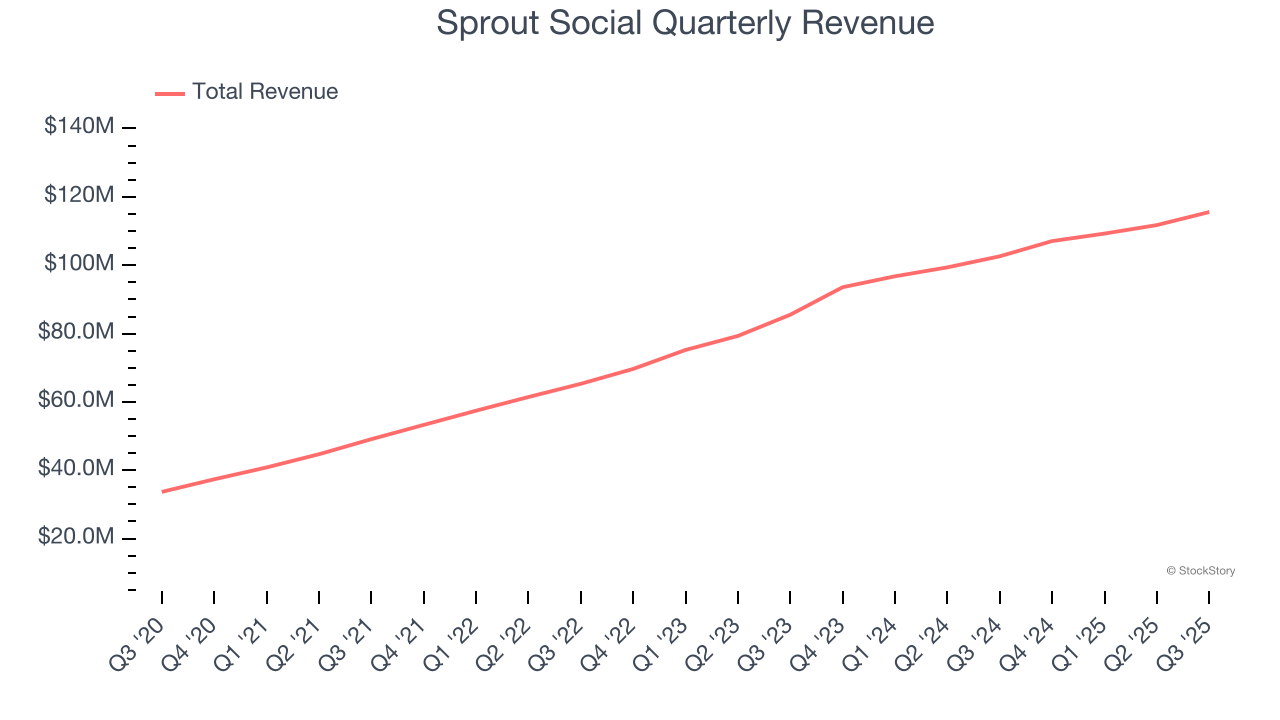
We at StockStory place the most emphasis on long-term growth, but within software, a half-decade historical view may miss recent innovations or disruptive industry trends. Sprout Social’s annualized revenue growth of 19.7% over the last two years is below its five-year trend, but we still think the results suggest healthy demand. 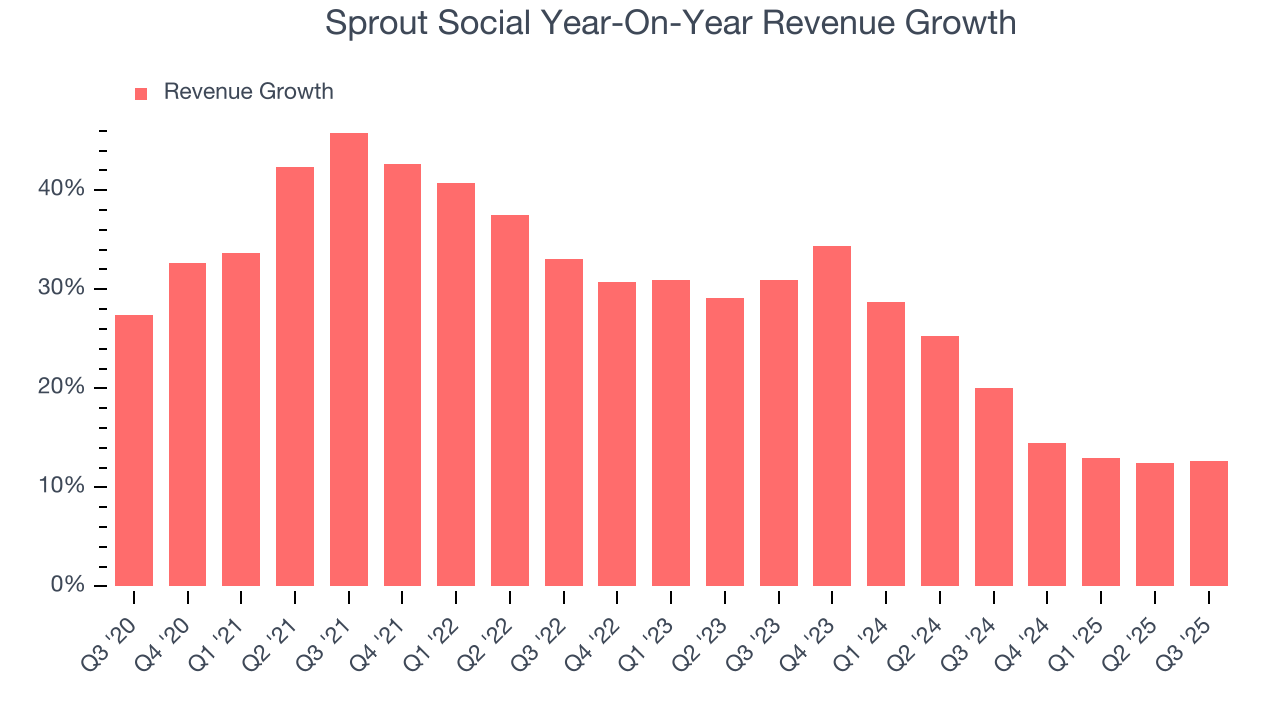
This quarter, Sprout Social reported year-on-year revenue growth of 12.6%, and its $115.6 million of revenue exceeded Wall Street’s estimates by 0.6%. Company management is currently guiding for a 10.7% year-on-year increase in sales next quarter.
Looking further ahead, sell-side analysts expect revenue to grow 11.1% over the next 12 months, a deceleration versus the last two years. This projection doesn't excite us and suggests its products and services will face some demand challenges.
While Wall Street chases Nvidia at all-time highs, an under-the-radar semiconductor supplier is dominating a critical AI component these giants can’t build without. Click here to access our free report one of our favorites growth stories.
Billings
Billings is a non-GAAP metric that is often called “cash revenue” because it shows how much money the company has collected from customers in a certain period. This is different from revenue, which must be recognized in pieces over the length of a contract.
Sprout Social’s billings came in at $114.1 million in Q3, and over the last four quarters, its growth was underwhelming as it averaged 10.4% year-on-year increases. This alternate topline metric grew slower than total sales, meaning the company recognizes revenue faster than it collects cash - a headwind for its liquidity that could also signal a slowdown in future revenue growth. 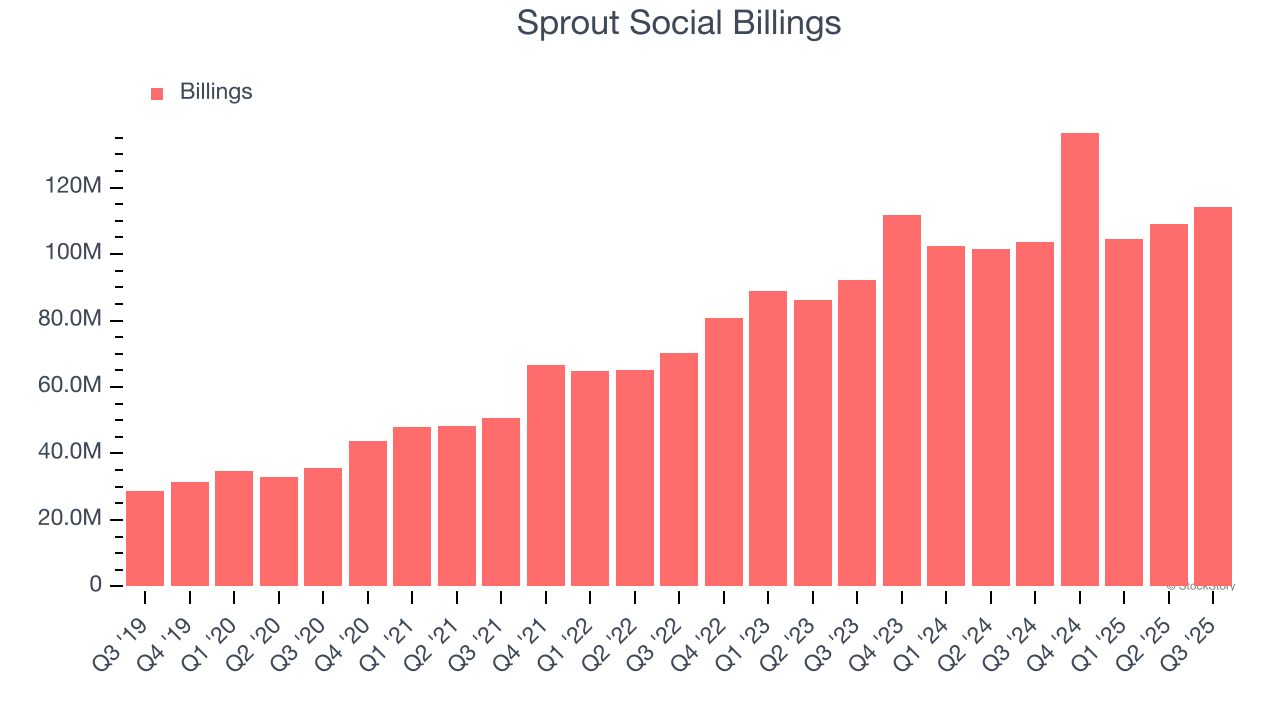
Enterprise Customer Base
This quarter, Sprout Social reported 9,756 enterprise customers paying more than $10,000 annually, an increase of 239 from the previous quarter. That’s quite a bit more contract wins than last quarter but also quite a bit below what we’ve observed over the previous year. This indicates the company is optimizing its go-to-market strategy to reinvigorate growth.
Key Takeaways from Sprout Social’s Q3 Results
We were impressed by Sprout Social’s optimistic full-year EPS guidance, which blew past analysts’ expectations. On the other hand, its EPS guidance for next quarter missed. Zooming out, we think this was a mixed quarter. The stock traded up 2.5% to $10.50 immediately following the results.
So do we think Sprout Social is an attractive buy at the current price? If you’re making that decision, you should consider the bigger picture of valuation, business qualities, as well as the latest earnings. We cover that in our actionable full research report which you can read here, it’s free for active Edge members.