
Semiconductor manufacturer Vishay Intertechnology (NYSE: VSH) announced better-than-expected revenue in Q3 CY2025, with sales up 7.5% year on year to $790.6 million. The company expects next quarter’s revenue to be around $790 million, close to analysts’ estimates. Its non-GAAP profit of $0.04 per share was in line with analysts’ consensus estimates.
Is now the time to buy Vishay Intertechnology? Find out by accessing our full research report, it’s free for active Edge members.
Vishay Intertechnology (VSH) Q3 CY2025 Highlights:
- Revenue: $790.6 million vs analyst estimates of $780.9 million (7.5% year-on-year growth, 1.2% beat)
- Adjusted EPS: $0.04 vs analyst estimates of $0.04 (in line)
- Adjusted EBITDA: $76 million vs analyst estimates of $69.22 million (9.6% margin, 9.8% beat)
- Revenue Guidance for Q4 CY2025 is $790 million at the midpoint, roughly in line with what analysts were expecting
- Operating Margin: 2.4%, up from -2.5% in the same quarter last year
- Free Cash Flow was -$24.33 million compared to -$8.83 million in the same quarter last year
- Inventory Days Outstanding: 109, down from 112 in the previous quarter
- Market Capitalization: $2.18 billion
“Our third quarter revenue growth demonstrates Vishay’s alignment with high growth markets including smart grid infrastructure, AI related power requirements, automotive and aerospace/defense while the market overall continues to gradually recover,” said Joel Smejkal, president and CEO.
Company Overview
Named after the founder's ancestral village in present-day Lithuania, Vishay Intertechnology (NYSE: VSH) manufactures simple chips and electronic components that are building blocks of virtually all types of electronic devices.
Revenue Growth
A company’s long-term sales performance can indicate its overall quality. Any business can have short-term success, but a top-tier one grows for years. Over the last five years, Vishay Intertechnology grew its sales at a mediocre 4.1% compounded annual growth rate. This fell short of our benchmark for the semiconductor sector and is a tough starting point for our analysis. Semiconductors are a cyclical industry, and long-term investors should be prepared for periods of high growth followed by periods of revenue contractions.
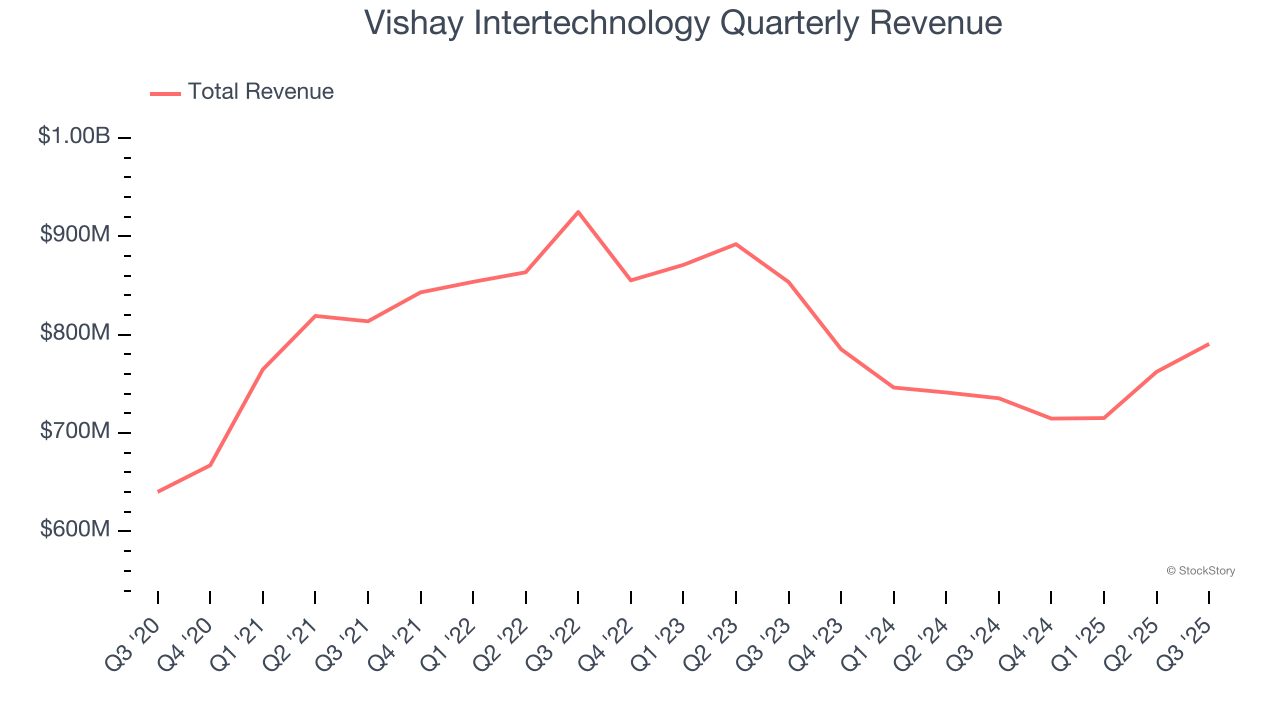
Long-term growth is the most important, but short-term results matter for semiconductors because the rapid pace of technological innovation (Moore's Law) could make yesterday's hit product obsolete today. Vishay Intertechnology’s performance shows it grew in the past but relinquished its gains over the last two years, as its revenue fell by 7.3% annually. 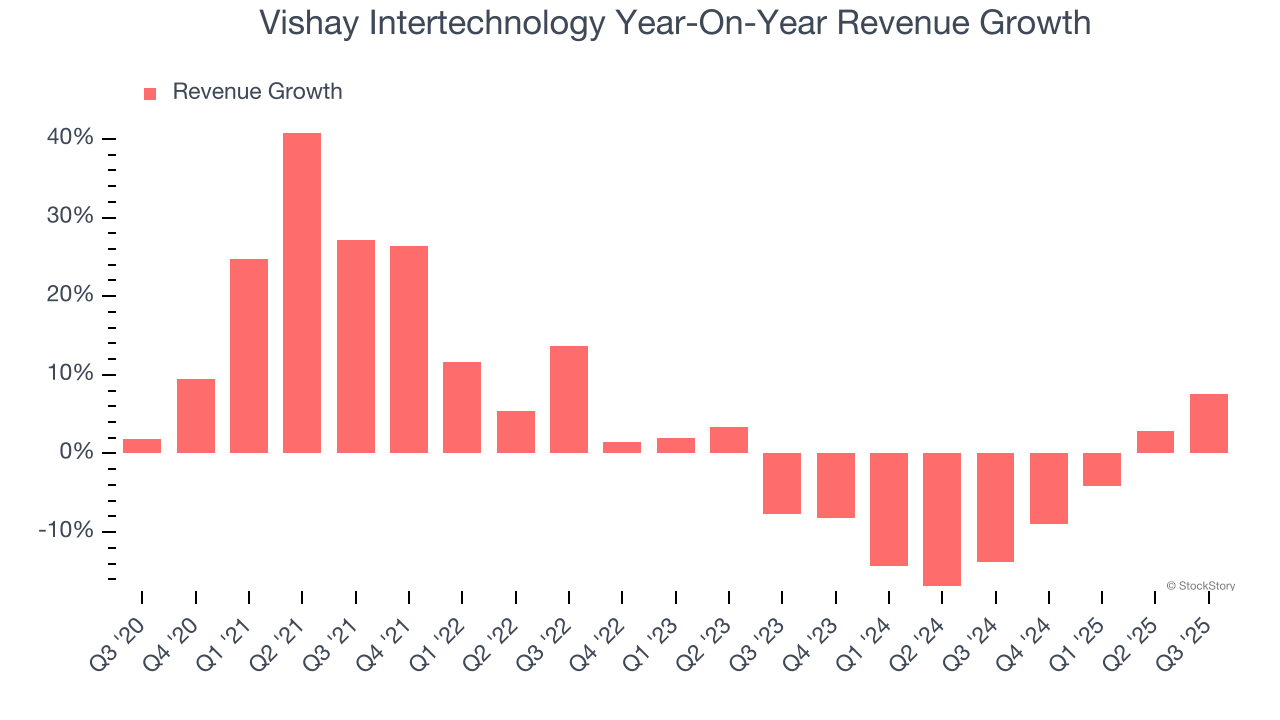
This quarter, Vishay Intertechnology reported year-on-year revenue growth of 7.5%, and its $790.6 million of revenue exceeded Wall Street’s estimates by 1.2%. Company management is currently guiding for a 10.5% year-on-year increase in sales next quarter.
Looking further ahead, sell-side analysts expect revenue to grow 8.1% over the next 12 months. While this projection implies its newer products and services will spur better top-line performance, it is still below the sector average.
Software is eating the world and there is virtually no industry left that has been untouched by it. That drives increasing demand for tools helping software developers do their jobs, whether it be monitoring critical cloud infrastructure, integrating audio and video functionality, or ensuring smooth content streaming. Click here to access a free report on our 3 favorite stocks to play this generational megatrend.
Product Demand & Outstanding Inventory
Days Inventory Outstanding (DIO) is an important metric for chipmakers, as it reflects a business’ capital intensity and the cyclical nature of semiconductor supply and demand. In a tight supply environment, inventories tend to be stable, allowing chipmakers to exert pricing power. Steadily increasing DIO can be a warning sign that demand is weak, and if inventories continue to rise, the company may have to downsize production.
This quarter, Vishay Intertechnology’s DIO came in at 109, which is 13 days above its five-year average. These numbers suggest that despite the recent decrease, the company’s inventory levels are higher than what we’ve seen in the past.

Key Takeaways from Vishay Intertechnology’s Q3 Results
It was good to see Vishay Intertechnology improve its inventory levels, even if just slightly. We were also happy its revenue narrowly outperformed Wall Street’s estimates. On the other hand, its EPS was in line. Overall, this was a mixed quarter. The stock remained flat at $16.03 immediately after reporting.
Vishay Intertechnology’s latest earnings report disappointed. One quarter doesn’t define a company’s quality, so let’s explore whether the stock is a buy at the current price. What happened in the latest quarter matters, but not as much as longer-term business quality and valuation, when deciding whether to invest in this stock. We cover that in our actionable full research report which you can read here, it’s free for active Edge members.


