
Footwear conglomerate Wolverine Worldwide (NYSE: WWW) beat Wall Street’s revenue expectations in Q3 CY2025, with sales up 6.9% year on year to $470.3 million. The company expects the full year’s revenue to be around $1.86 billion, close to analysts’ estimates. Its non-GAAP profit of $0.36 per share was 9.2% above analysts’ consensus estimates.
Is now the time to buy Wolverine Worldwide? Find out by accessing our full research report, it’s free for active Edge members.
Wolverine Worldwide (WWW) Q3 CY2025 Highlights:
- Revenue: $470.3 million vs analyst estimates of $463.8 million (6.9% year-on-year growth, 1.4% beat)
- Adjusted EPS: $0.36 vs analyst estimates of $0.33 (9.2% beat)
- Adjusted EBITDA: $47.4 million vs analyst estimates of $46.38 million (10.1% margin, 2.2% beat)
- Adjusted EPS guidance for the full year is $1.32 at the midpoint, missing analyst estimates by 1.1%
- Operating Margin: 8.4%, in line with the same quarter last year
- Free Cash Flow Margin: 6.4%, down from 23.7% in the same quarter last year
- Market Capitalization: $1.79 billion
"We delivered a solid quarter with Merrell, Saucony, and Sweaty Betty all exceeding expectations. Our disciplined execution, coupled with another record gross margin quarter, delivered better-than-anticipated earnings per share," said Chris Hufnagel, President and Chief Executive Officer of Wolverine Worldwide.
Company Overview
Founded in 1883, Wolverine Worldwide (NYSE: WWW) is a global footwear company with a diverse portfolio of brands including Merrell, Hush Puppies, and Saucony.
Revenue Growth
A company’s long-term sales performance can indicate its overall quality. Even a bad business can shine for one or two quarters, but a top-tier one grows for years. Unfortunately, Wolverine Worldwide struggled to consistently increase demand as its $1.85 billion of sales for the trailing 12 months was close to its revenue five years ago. This was below our standards and suggests it’s a low quality business.
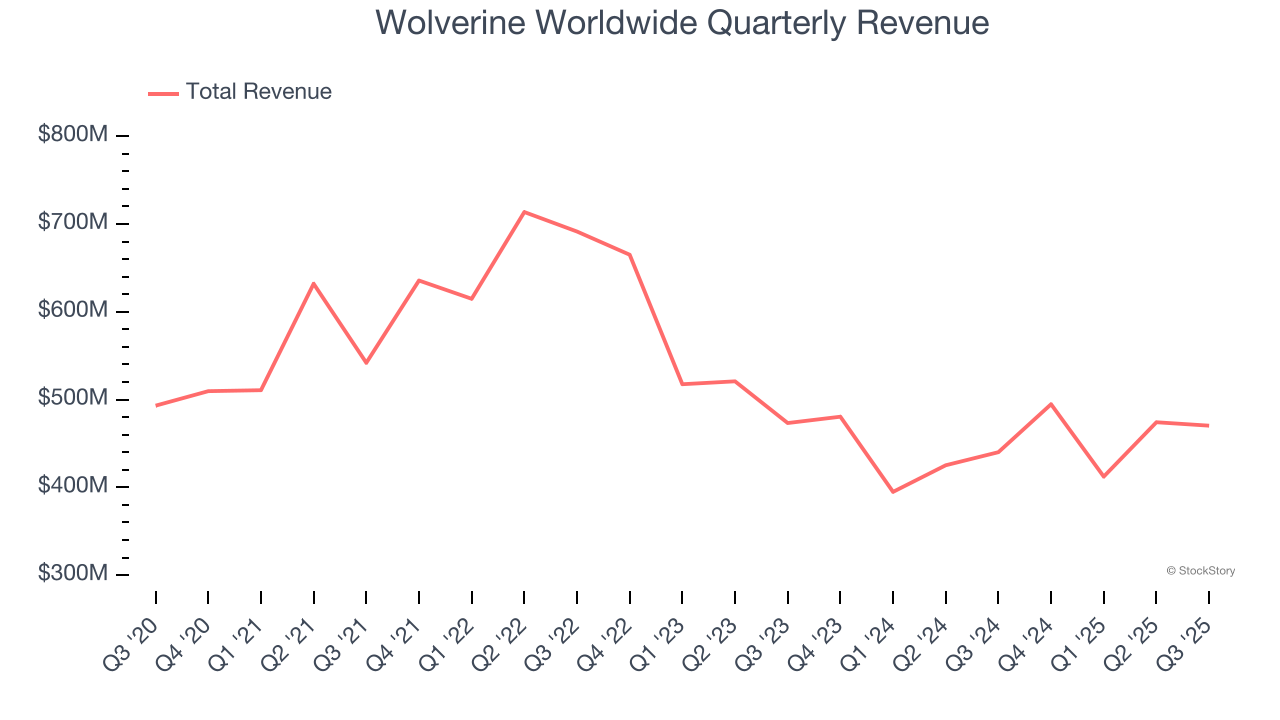
We at StockStory place the most emphasis on long-term growth, but within consumer discretionary, a stretched historical view may miss a company riding a successful new product or trend. Wolverine Worldwide’s recent performance shows its demand remained suppressed as its revenue has declined by 7.8% annually over the last two years. 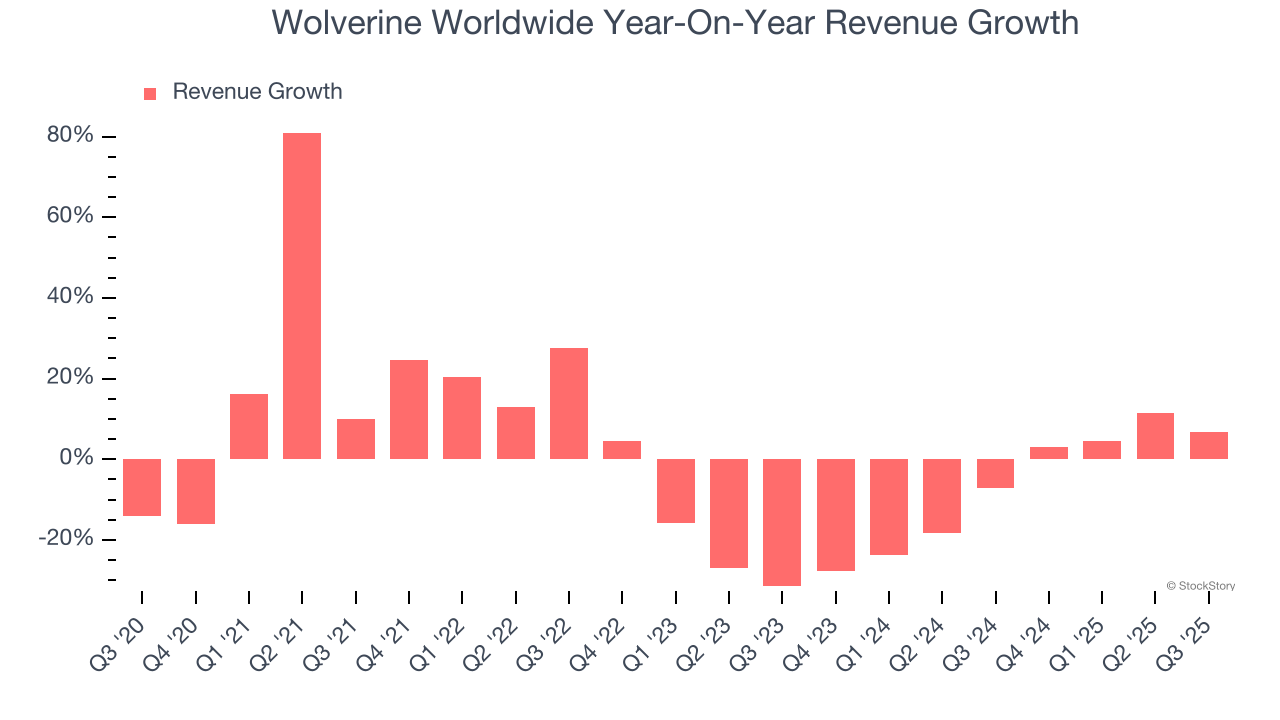
This quarter, Wolverine Worldwide reported year-on-year revenue growth of 6.9%, and its $470.3 million of revenue exceeded Wall Street’s estimates by 1.4%.
Looking ahead, sell-side analysts expect revenue to grow 6% over the next 12 months. Although this projection indicates its newer products and services will fuel better top-line performance, it is still below average for the sector.
The 1999 book Gorilla Game predicted Microsoft and Apple would dominate tech before it happened. Its thesis? Identify the platform winners early. Today, enterprise software companies embedding generative AI are becoming the new gorillas. a profitable, fast-growing enterprise software stock that is already riding the automation wave and looking to catch the generative AI next.
Operating Margin
Operating margin is an important measure of profitability as it shows the portion of revenue left after accounting for all core expenses – everything from the cost of goods sold to advertising and wages. It’s also useful for comparing profitability across companies with different levels of debt and tax rates because it excludes interest and taxes.
Wolverine Worldwide’s operating margin has risen over the last 12 months, leading to break even profits over the last two years. However, its large expense base and inefficient cost structure mean it still sports inadequate profitability for a consumer discretionary business.
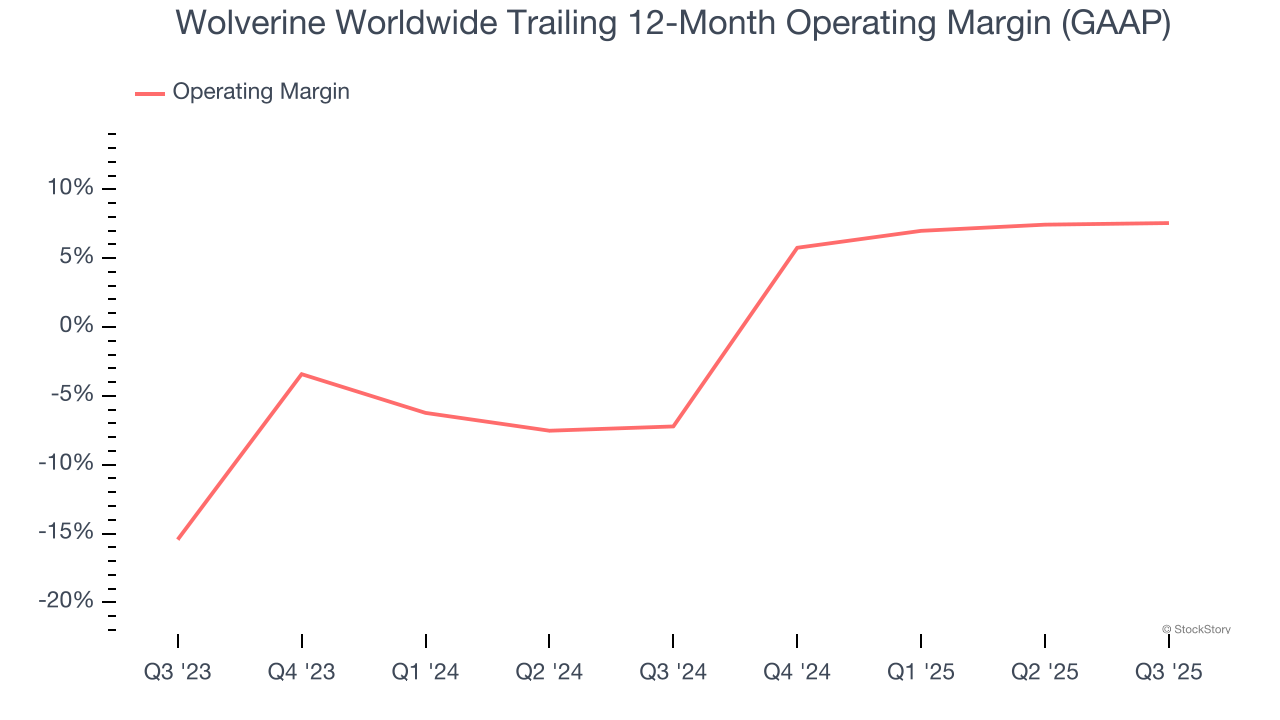
In Q3, Wolverine Worldwide generated an operating margin profit margin of 8.4%, in line with the same quarter last year. This indicates the company’s overall cost structure has been relatively stable.
Earnings Per Share
We track the long-term change in earnings per share (EPS) for the same reason as long-term revenue growth. Compared to revenue, however, EPS highlights whether a company’s growth is profitable.
Wolverine Worldwide’s EPS was flat over the last five years, just like its revenue. This performance was underwhelming across the board.
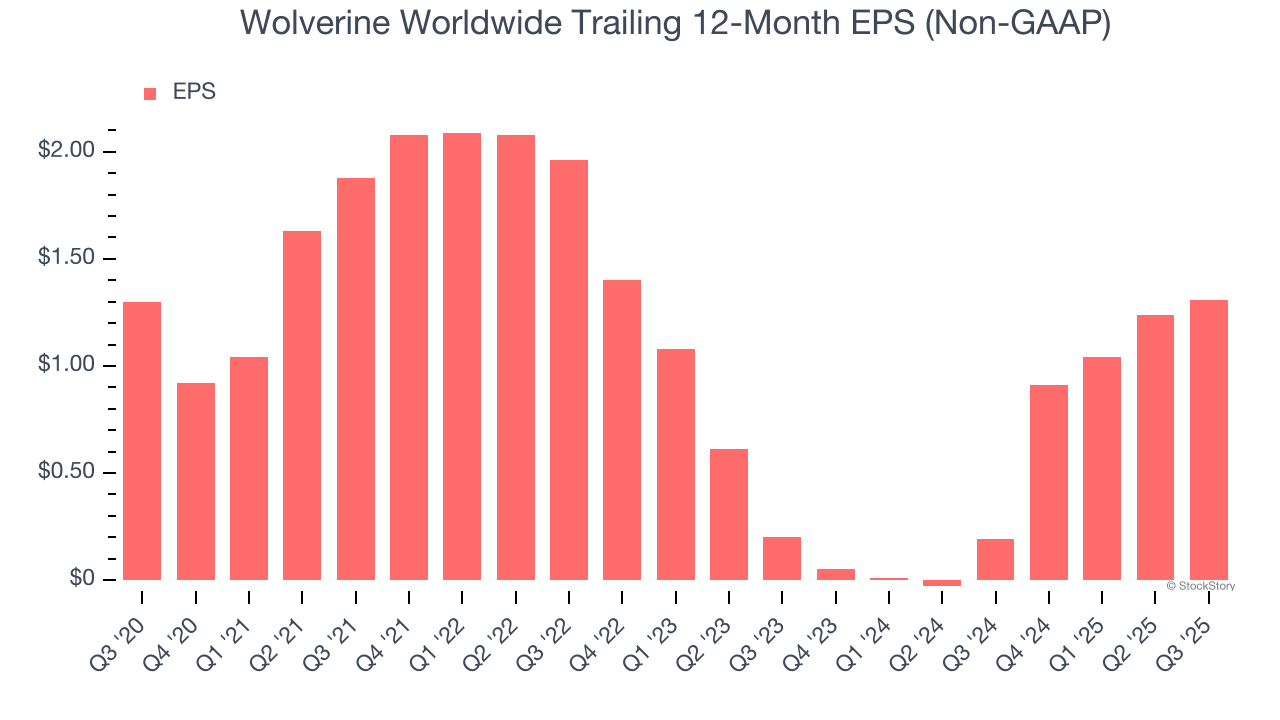
In Q3, Wolverine Worldwide reported adjusted EPS of $0.36, up from $0.29 in the same quarter last year. This print beat analysts’ estimates by 9.2%. Over the next 12 months, Wall Street expects Wolverine Worldwide’s full-year EPS of $1.31 to grow 15.1%.
Key Takeaways from Wolverine Worldwide’s Q3 Results
It was good to see Wolverine Worldwide beat analysts’ EPS expectations this quarter. We were also happy its revenue narrowly outperformed Wall Street’s estimates. On the other hand, its full-year revenue guidance was in line and its full-year EPS guidance fell slightly short of Wall Street’s estimates. Zooming out, we think this was a mixed quarter. The market seemed to be hoping for more, and the stock traded down 8.6% to $20.20 immediately after reporting.
Is Wolverine Worldwide an attractive investment opportunity at the current price? We think that the latest quarter is only one piece of the longer-term business quality puzzle. Quality, when combined with valuation, can help determine if the stock is a buy. We cover that in our actionable full research report which you can read here, it’s free for active Edge members.


