
Although PNC Financial Services Group (currently trading at $183.70 per share) has gained 12.3% over the last six months, it has trailed the S&P 500’s 21.3% return during that period. This may have investors wondering how to approach the situation.
Given the relatively weaker price action, is now a good time to buy PNC? Or are investors better off allocating their money elsewhere?
Why Does PNC Financial Services Group Spark Debate?
Tracing its roots back to 1852 when Pittsburgh's industrial boom demanded stronger financial institutions, PNC (NYSE: PNC) is a diversified financial institution that provides retail banking, corporate banking, and asset management services through a coast-to-coast branch network.
Two Positive Attributes:
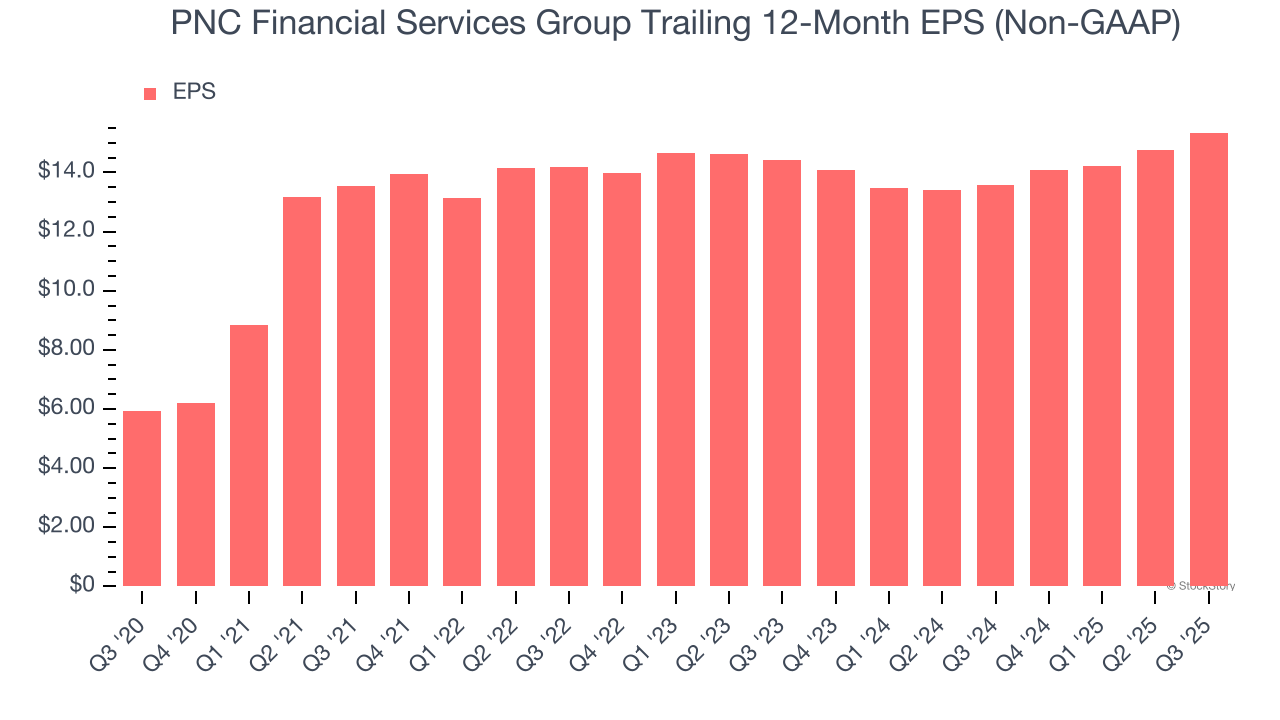
1. Outstanding Long-Term EPS Growth
We track the long-term change in earnings per share (EPS) because it highlights whether a company’s growth is profitable.
PNC Financial Services Group’s EPS grew at an astounding 21% compounded annual growth rate over the last five years, higher than its 5.8% annualized revenue growth. This tells us the company became more profitable on a per-share basis as it expanded.
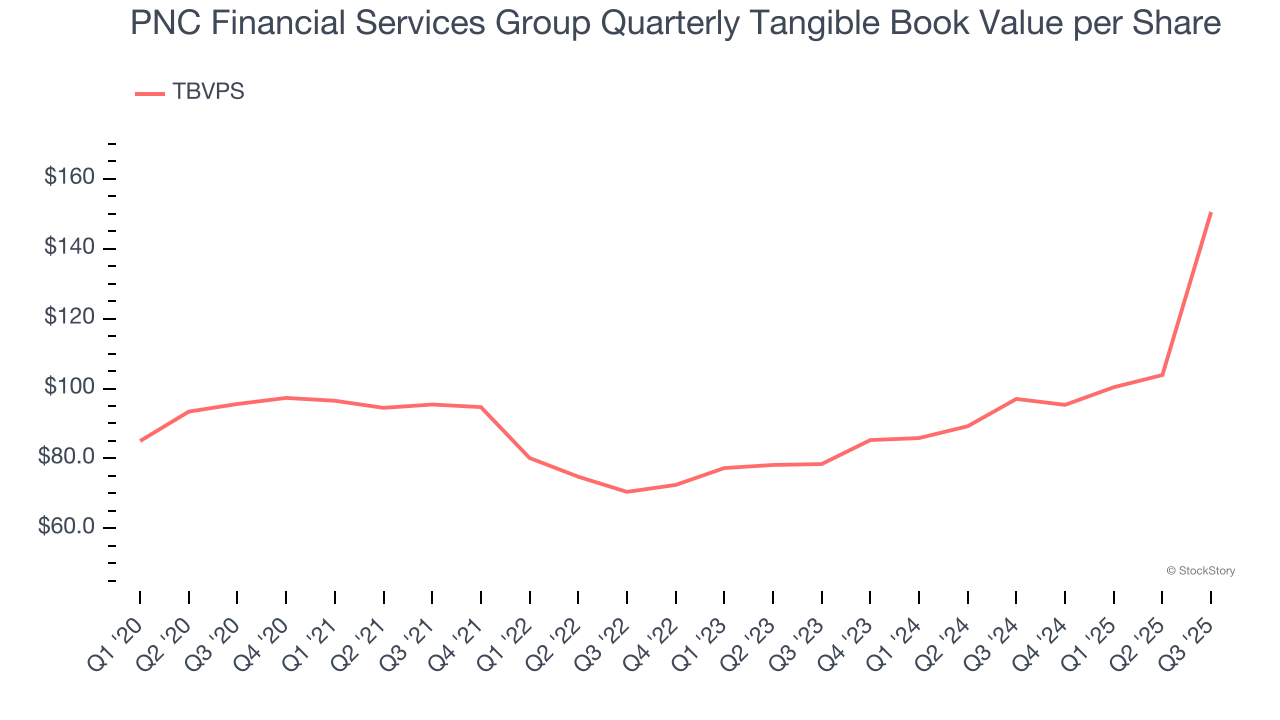
2. Growing TBVPS Reflects Strong Asset Base
For banks, tangible book value per share (TBVPS) is a crucial metric that measures the actual value of shareholders’ equity, stripping out goodwill and other intangible assets that may not be recoverable in a worst-case scenario.
PNC Financial Services Group’s TBVPS increased by 9.5% annually over the last five years, and growth has recently accelerated as TBVPS grew at an incredible 38.5% annual clip over the past two years (from $78.40 to $150.48 per share).
One Reason to be Careful:
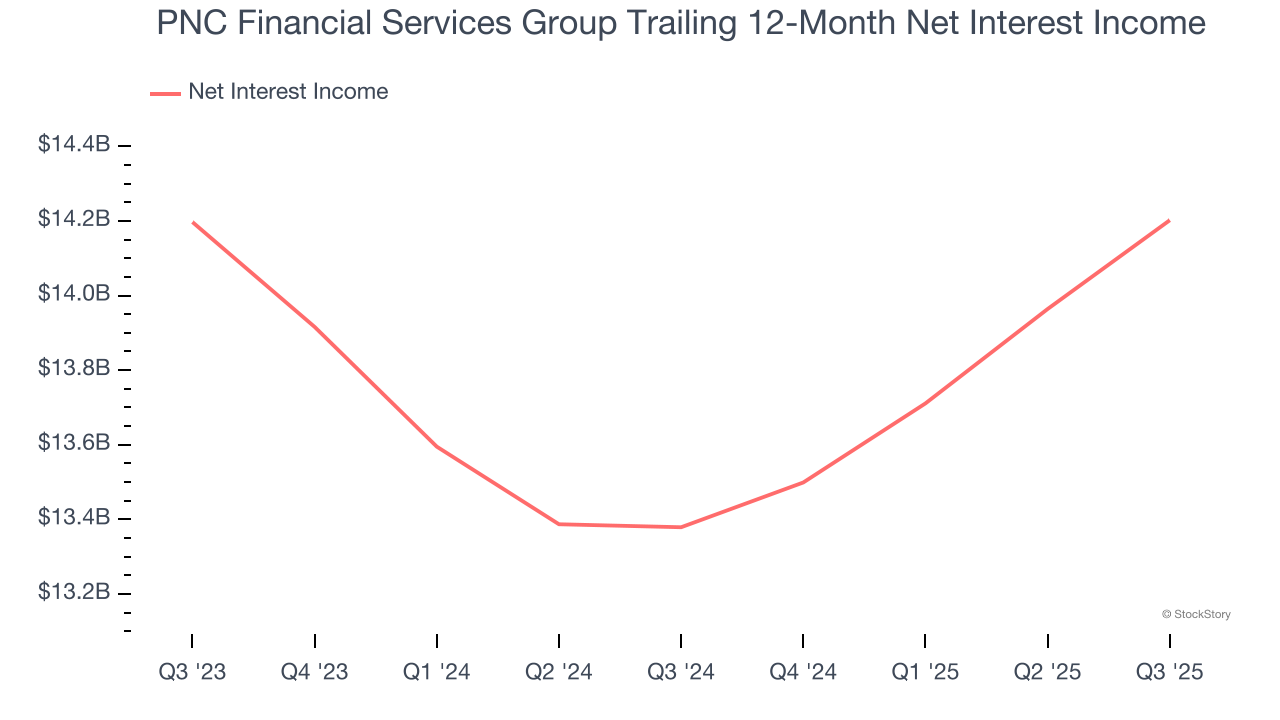
Net Interest Income Points to Soft Demand
Net interest income commands greater market attention due to its reliability and consistency, whereas one-time fees are often seen as lower-quality revenue that lacks the same dependable characteristics.
PNC Financial Services Group’s net interest income has grown at a 7.3% annualized rate over the last five years, slightly worse than the broader banking industry. Its growth was driven by both an increase in its outstanding loans and net interest margin, which represents how much a bank earns in relation to its outstanding loan book.
Final Judgment
PNC Financial Services Group has huge potential even though it has some open questions. With its shares lagging the market recently, the stock trades at 1.3× forward P/B (or $183.70 per share). Is now the time to initiate a position? See for yourself in our comprehensive research report, it’s free for active Edge members .
Stocks We Like Even More Than PNC Financial Services Group
Donald Trump’s April 2025 "Liberation Day" tariffs sent markets into a tailspin, but stocks have since rebounded strongly, proving that knee-jerk reactions often create the best buying opportunities.
The smart money is already positioning for the next leg up. Don’t miss out on the recovery - check out our Top 6 Stocks for this week. This is a curated list of our High Quality stocks that have generated a market-beating return of 183% over the last five years (as of March 31st 2025).
Stocks that made our list in 2020 include now familiar names such as Nvidia (+1,545% between March 2020 and March 2025) as well as under-the-radar businesses like the once-small-cap company Exlservice (+354% five-year return). Find your next big winner with StockStory today.
StockStory is growing and hiring equity analyst and marketing roles. Are you a 0 to 1 builder passionate about the markets and AI? See the open roles here.