
Over the past six months, CoStar’s shares (currently trading at $70.35) have posted a disappointing 5.7% loss, well below the S&P 500’s 21.3% gain. This may have investors wondering how to approach the situation.
Given the weaker price action, is this a buying opportunity for CSGP? Find out in our full research report, it’s free for active Edge members.
Why Does CoStar Spark Debate?
With a research department that makes over 10,000 property updates daily to its 35-year-old database, CoStar Group (NASDAQ: CSGP) provides comprehensive real estate data, analytics, and online marketplaces for commercial and residential properties in the U.S. and U.K.
Two Things to Like:
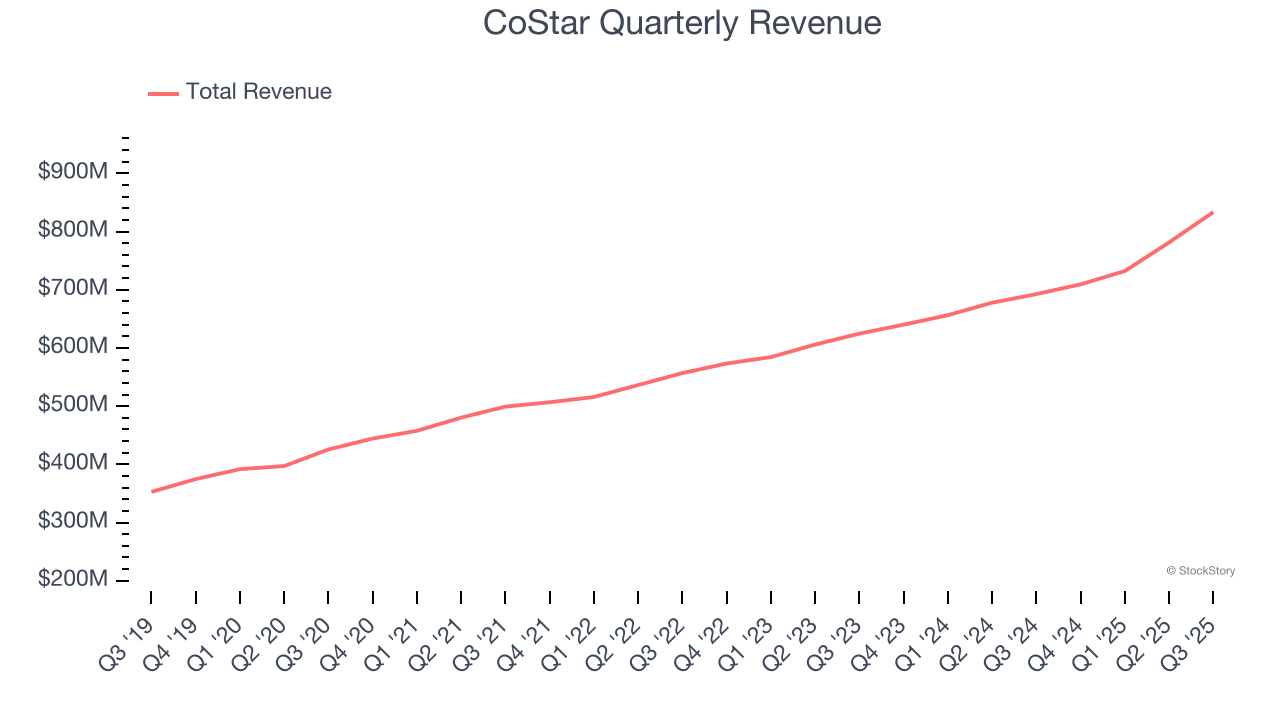
1. Skyrocketing Revenue Shows Strong Momentum
Examining a company’s long-term performance can provide clues about its quality. Even a bad business can shine for one or two quarters, but a top-tier one grows for years. Thankfully, CoStar’s 14% annualized revenue growth over the last five years was exceptional. Its growth surpassed the average business services company and shows its offerings resonate with customers.
2. Projected Revenue Growth Is Remarkable
Forecasted revenues by Wall Street analysts signal a company’s potential. Predictions may not always be accurate, but accelerating growth typically boosts valuation multiples and stock prices while slowing growth does the opposite, though some deceleration is natural as businesses become larger.
Over the next 12 months, sell-side analysts expect CoStar’s revenue to rise by 21.2%, an improvement versus its 14% annualized growth for the past five years. This projection is eye-popping and suggests its newer products and services will fuel better top-line performance.
One Reason to be Careful:
New Investments Fail to Bear Fruit as ROIC Declines
A company’s ROIC, or return on invested capital, shows how much operating profit it makes compared to the money it has raised (debt and equity).
We like to invest in businesses with high returns, but the trend in a company’s ROIC is what often surprises the market and moves the stock price. Unfortunately, CoStar’s ROIC has decreased significantly over the last few years. If its returns keep falling, it could suggest its profitable growth opportunities are drying up. We’ll keep a close eye.

Final Judgment
CoStar’s merits more than compensate for its flaws. After the recent drawdown, the stock trades at 58.3× forward P/E (or $70.35 per share). Is now the right time to buy? See for yourself in our full research report, it’s free for active Edge members.
High-Quality Stocks for All Market Conditions
Trump’s April 2025 tariff bombshell triggered a massive market selloff, but stocks have since staged an impressive recovery, leaving those who panic sold on the sidelines.
Take advantage of the rebound by checking out our Top 9 Market-Beating Stocks. This is a curated list of our High Quality stocks that have generated a market-beating return of 183% over the last five years (as of March 31st 2025).
Stocks that made our list in 2020 include now familiar names such as Nvidia (+1,545% between March 2020 and March 2025) as well as under-the-radar businesses like the once-small-cap company Exlservice (+354% five-year return). Find your next big winner with StockStory today.
StockStory is growing and hiring equity analyst and marketing roles. Are you a 0 to 1 builder passionate about the markets and AI? See the open roles here.