Over the past six months, Darden’s stock price fell to $180.10. Shareholders have lost 9.3% of their capital, which is disappointing considering the S&P 500 has climbed by 21.3%. This was partly driven by its softer quarterly results and may have investors wondering how to approach the situation.
Is now the time to buy Darden, or should you be careful about including it in your portfolio? See what our analysts have to say in our full research report, it’s free for active Edge members.
Why Is Darden Not Exciting?
Even with the cheaper entry price, we're cautious about Darden. Here are three reasons we avoid DRI and a stock we'd rather own.
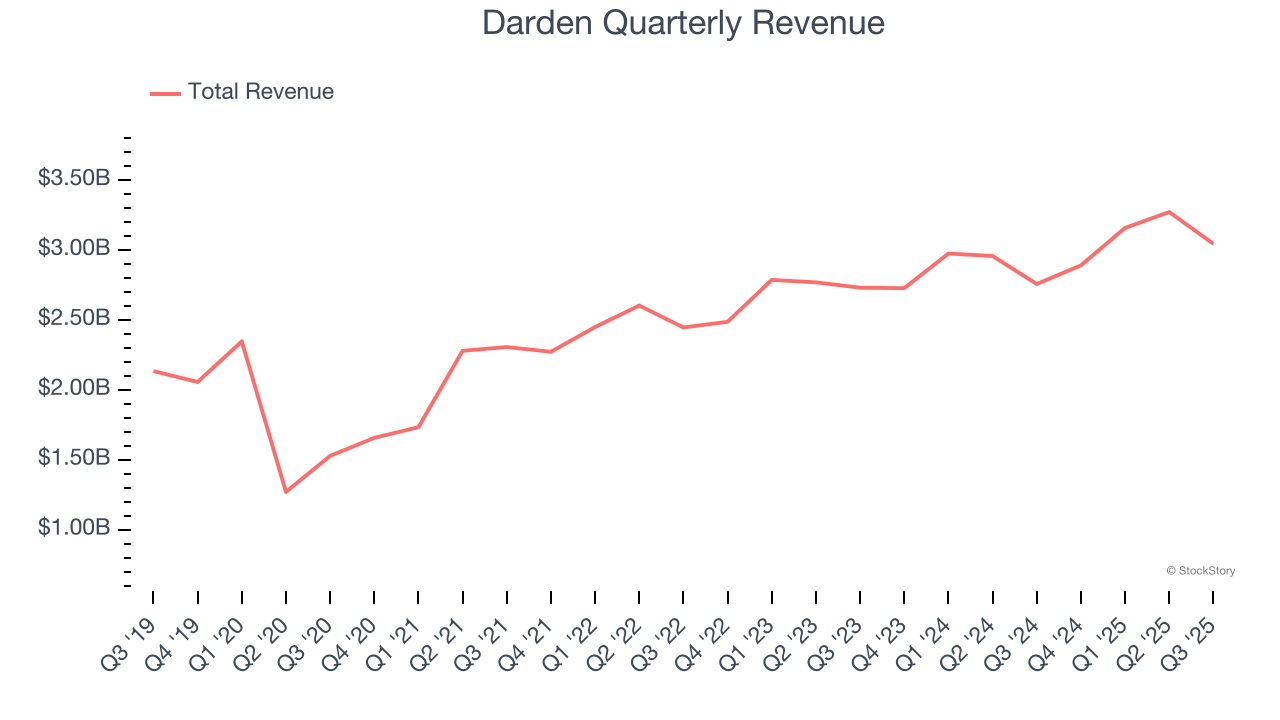
1. Long-Term Revenue Growth Disappoints
A company’s long-term performance is an indicator of its overall quality. Any business can put up a good quarter or two, but the best consistently grow over the long haul. Regrettably, Darden’s sales grew at a mediocre 6.3% compounded annual growth rate over the last six years. This fell short of our benchmark for the restaurant sector.
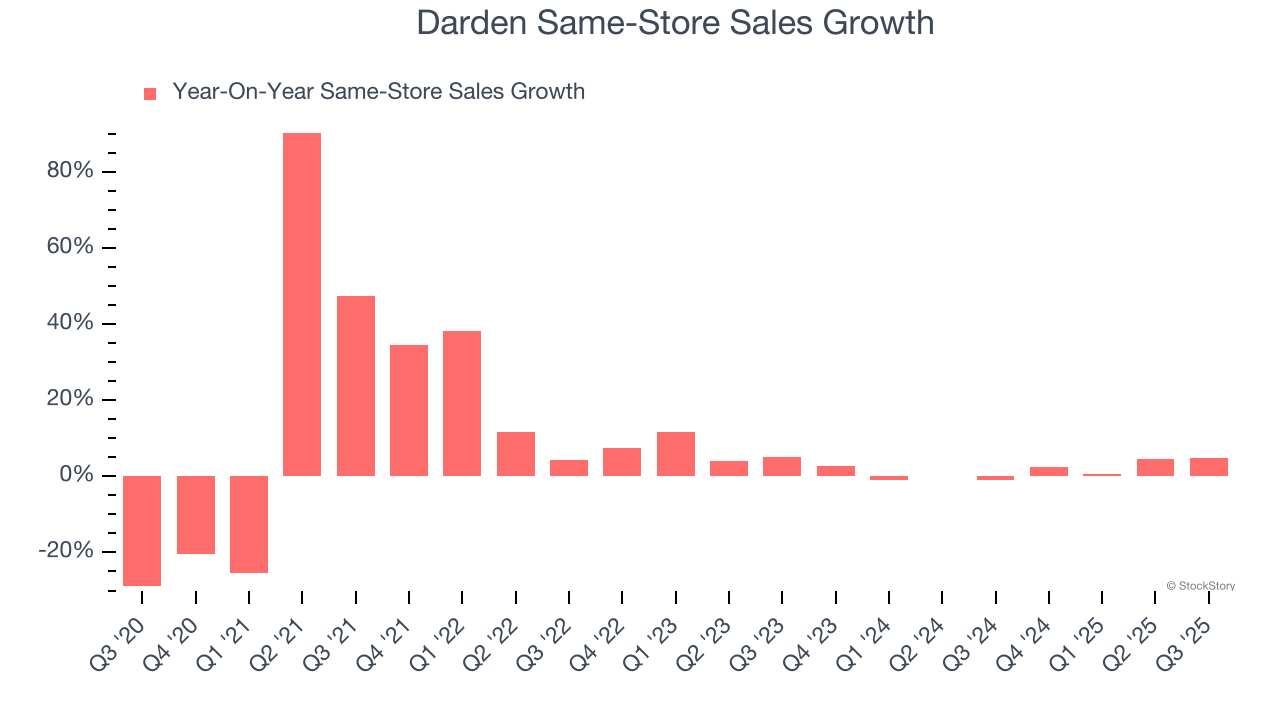
2. Same-Store Sales Falling Behind Peers
Same-store sales is a key performance indicator used to measure organic growth at restaurants open for at least a year.
Darden’s demand within its existing dining locations has been relatively stable over the last two years but was below most restaurant chains. On average, the company’s same-store sales have grown by 1.6% per year.
3. Low Gross Margin Reveals Weak Structural Profitability
Gross profit margins are an important measure of a restaurant’s pricing power and differentiation, whether it be the dining experience or quality and taste of food.
Darden has bad unit economics for a restaurant company, giving it less room to reinvest and grow its presence. As you can see below, it averaged a 21.6% gross margin over the last two years. That means Darden paid its suppliers a lot of money ($78.37 for every $100 in revenue) to run its business. 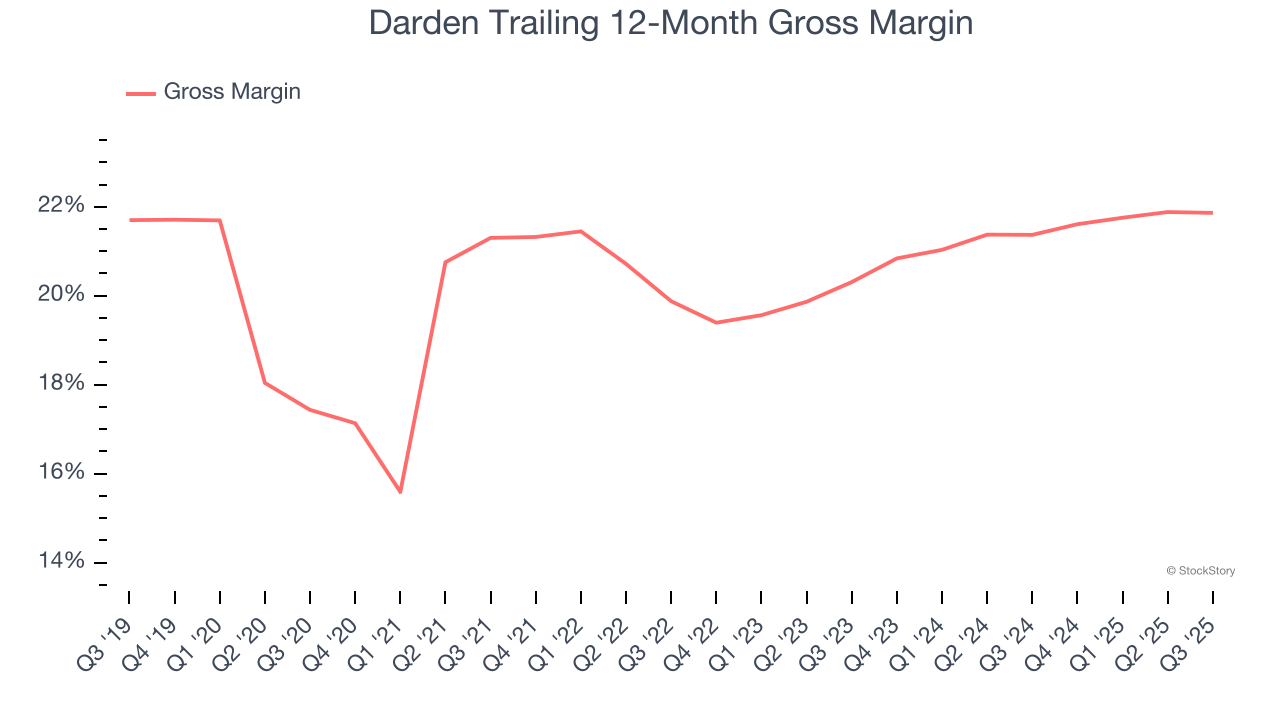
Final Judgment
Darden isn’t a terrible business, but it doesn’t pass our quality test. After the recent drawdown, the stock trades at 16.7× forward P/E (or $180.10 per share). While this valuation is reasonable, we don’t really see a big opportunity at the moment. We're fairly confident there are better investments elsewhere. We’d recommend looking at our favorite semiconductor picks and shovels play.
High-Quality Stocks for All Market Conditions
Fresh US-China trade tensions just tanked stocks—but strong bank earnings are fueling a sharp rebound. Don’t miss the bounce.
Don’t let fear keep you from great opportunities and take a look at Top 5 Strong Momentum Stocks for this week. This is a curated list of our High Quality stocks that have generated a market-beating return of 183% over the last five years (as of March 31st 2025).
Stocks that made our list in 2020 include now familiar names such as Nvidia (+1,545% between March 2020 and March 2025) as well as under-the-radar businesses like the once-small-cap company Comfort Systems (+782% five-year return). Find your next big winner with StockStory today.
StockStory is growing and hiring equity analyst and marketing roles. Are you a 0 to 1 builder passionate about the markets and AI? See the open roles here.