Hexcel’s 38% return over the past six months has outpaced the S&P 500 by 16.7%, and its stock price has climbed to $69.67 per share. This run-up might have investors contemplating their next move.
Is now the time to buy Hexcel, or should you be careful about including it in your portfolio? Get the full breakdown from our expert analysts, it’s free for active Edge members.
Why Do We Think Hexcel Will Underperform?
Despite the momentum, we're sitting this one out for now. Here are three reasons why HXL doesn't excite us and a stock we'd rather own.
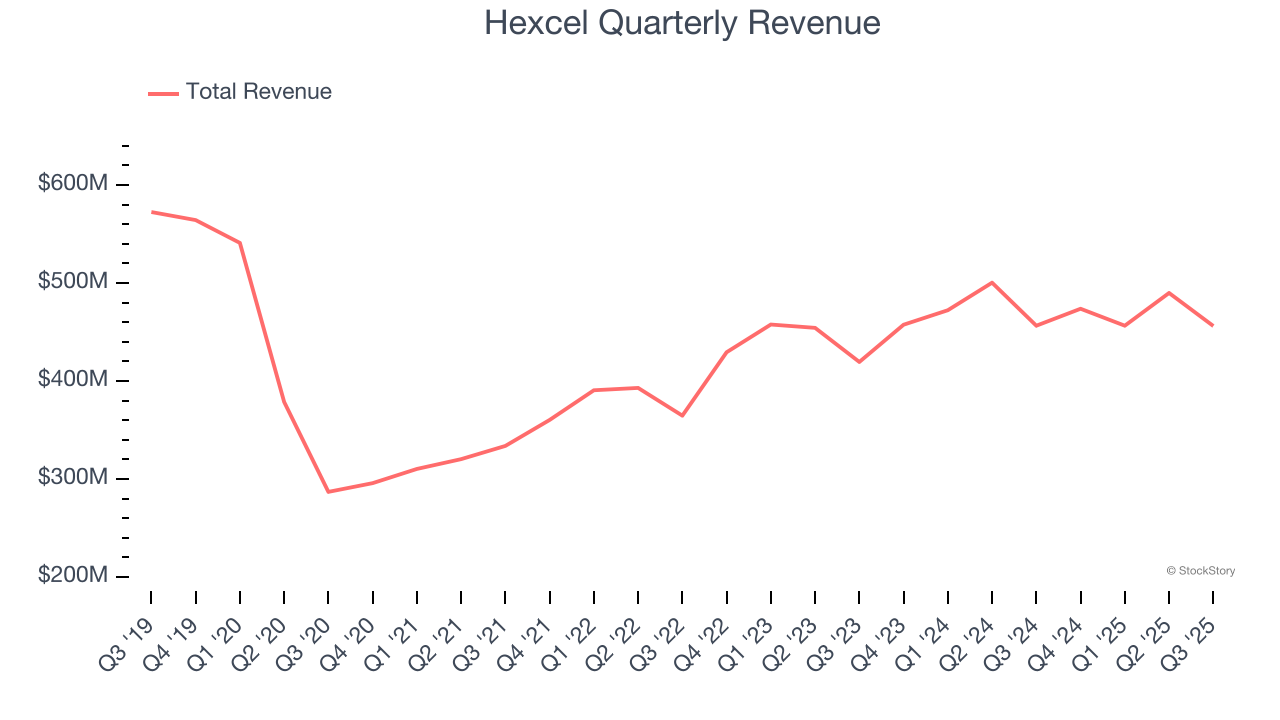
1. Long-Term Revenue Growth Disappoints
A company’s long-term sales performance is one signal of its overall quality. Any business can have short-term success, but a top-tier one grows for years. Unfortunately, Hexcel’s 1.2% annualized revenue growth over the last five years was weak. This fell short of our benchmarks.
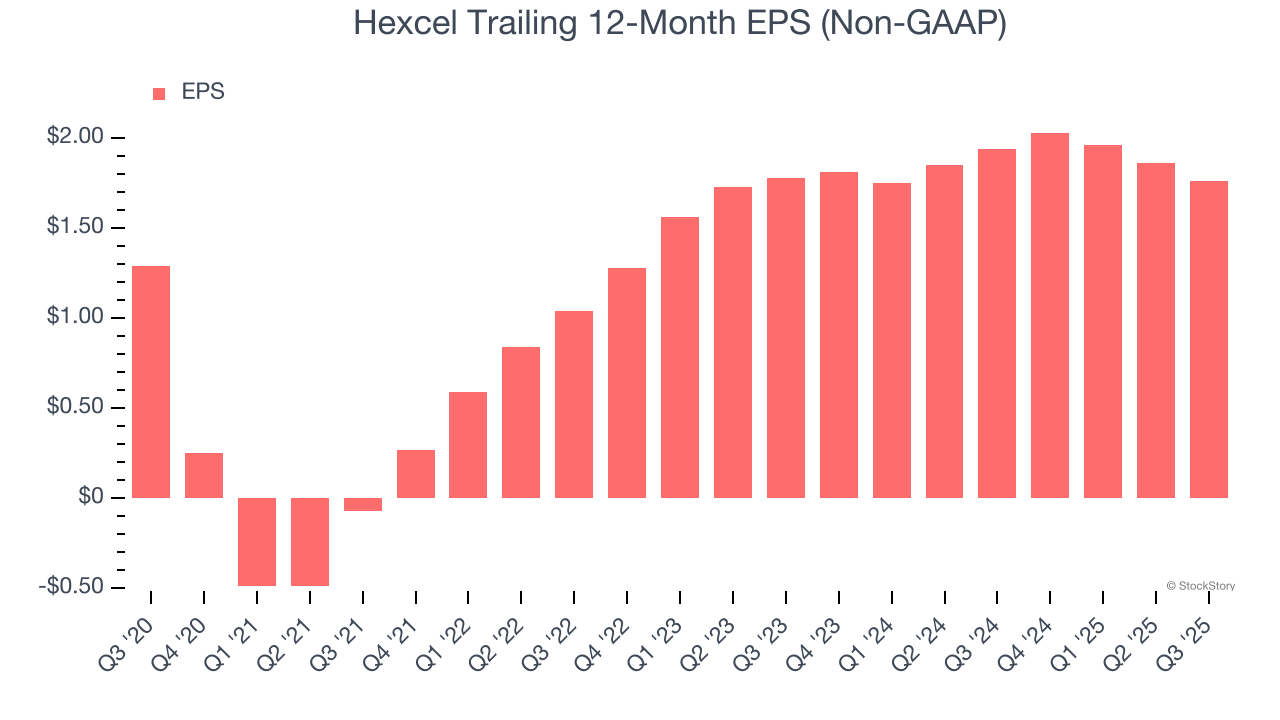
2. EPS Barely Growing
We track the long-term change in earnings per share (EPS) because it highlights whether a company’s growth is profitable.
Hexcel’s EPS grew at an unimpressive 6.4% compounded annual growth rate over the last five years. On the bright side, this performance was better than its 1.2% annualized revenue growth and tells us the company became more profitable on a per-share basis as it expanded.
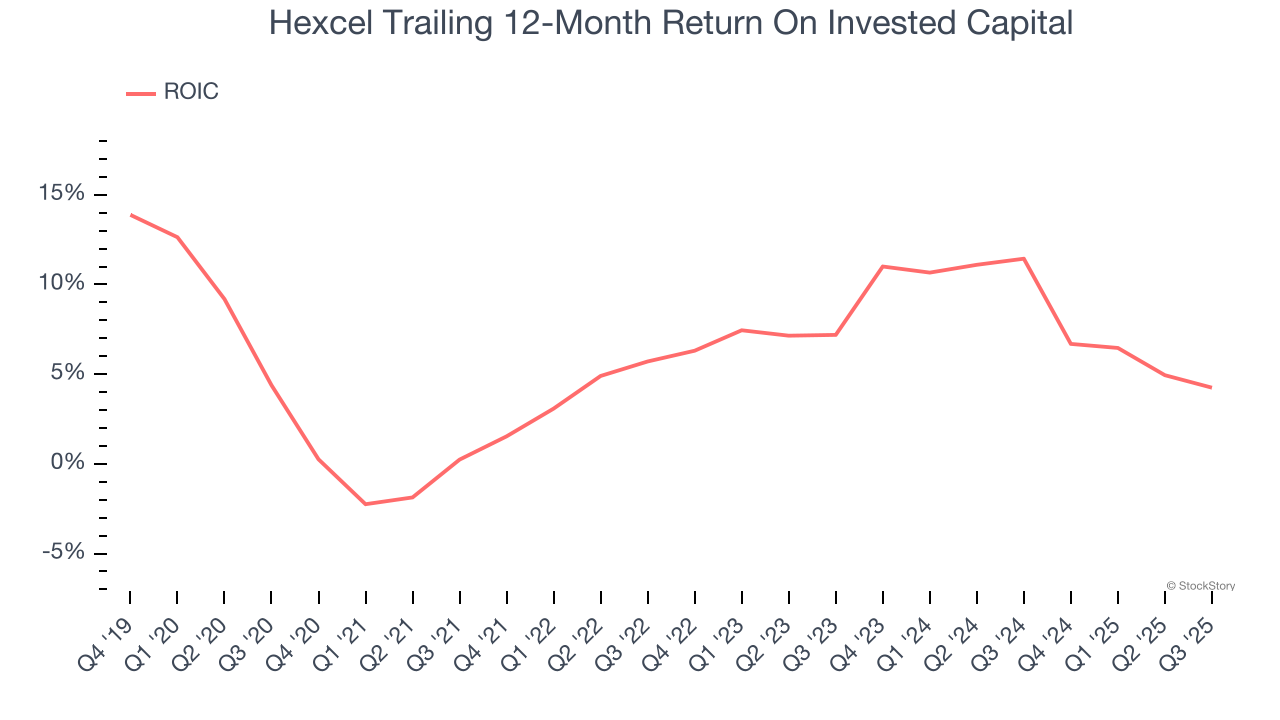
3. Previous Growth Initiatives Haven’t Impressed
Growth gives us insight into a company’s long-term potential, but how capital-efficient was that growth? A company’s ROIC explains this by showing how much operating profit it makes compared to the money it has raised (debt and equity).
Hexcel historically did a mediocre job investing in profitable growth initiatives. Its five-year average ROIC was 5.8%, somewhat low compared to the best industrials companies that consistently pump out 20%+.
Final Judgment
We see the value of companies helping their customers, but in the case of Hexcel, we’re out. With its shares beating the market recently, the stock trades at 32.1× forward P/E (or $69.67 per share). This valuation tells us a lot of optimism is priced in - you can find more timely opportunities elsewhere. We’d suggest looking at the most dominant software business in the world.
Stocks We Like More Than Hexcel
Fresh US-China trade tensions just tanked stocks—but strong bank earnings are fueling a sharp rebound. Don’t miss the bounce.
Don’t let fear keep you from great opportunities and take a look at Top 6 Stocks for this week. This is a curated list of our High Quality stocks that have generated a market-beating return of 183% over the last five years (as of March 31st 2025).
Stocks that made our list in 2020 include now familiar names such as Nvidia (+1,545% between March 2020 and March 2025) as well as under-the-radar businesses like the once-small-cap company Exlservice (+354% five-year return). Find your next big winner with StockStory today.
StockStory is growing and hiring equity analyst and marketing roles. Are you a 0 to 1 builder passionate about the markets and AI? See the open roles here.