
Over the last six months, Quanex’s shares have sunk to $13.64, producing a disappointing 18.6% loss - a stark contrast to the S&P 500’s 21.3% gain. This was partly driven by its softer quarterly results and might have investors contemplating their next move.
Is there a buying opportunity in Quanex, or does it present a risk to your portfolio? Get the full stock story straight from our expert analysts, it’s free for active Edge members.
Why Is Quanex Not Exciting?
Even though the stock has become cheaper, we don't have much confidence in Quanex. Here are three reasons why NX doesn't excite us and a stock we'd rather own.
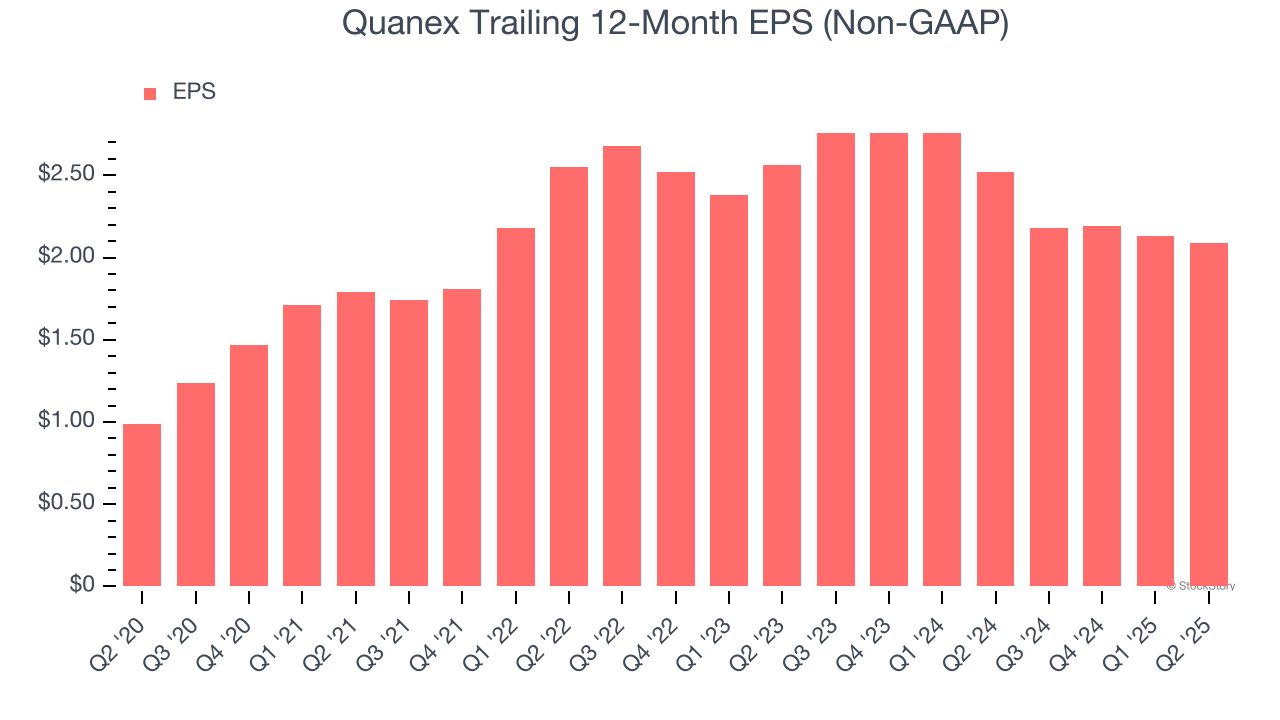
1. EPS Took a Dip Over the Last Two Years
Although long-term earnings trends give us the big picture, we like to analyze EPS over a shorter period to see if we are missing a change in the business.
Sadly for Quanex, its EPS declined by 9.6% annually over the last two years while its revenue grew by 26.9%. This tells us the company became less profitable on a per-share basis as it expanded.
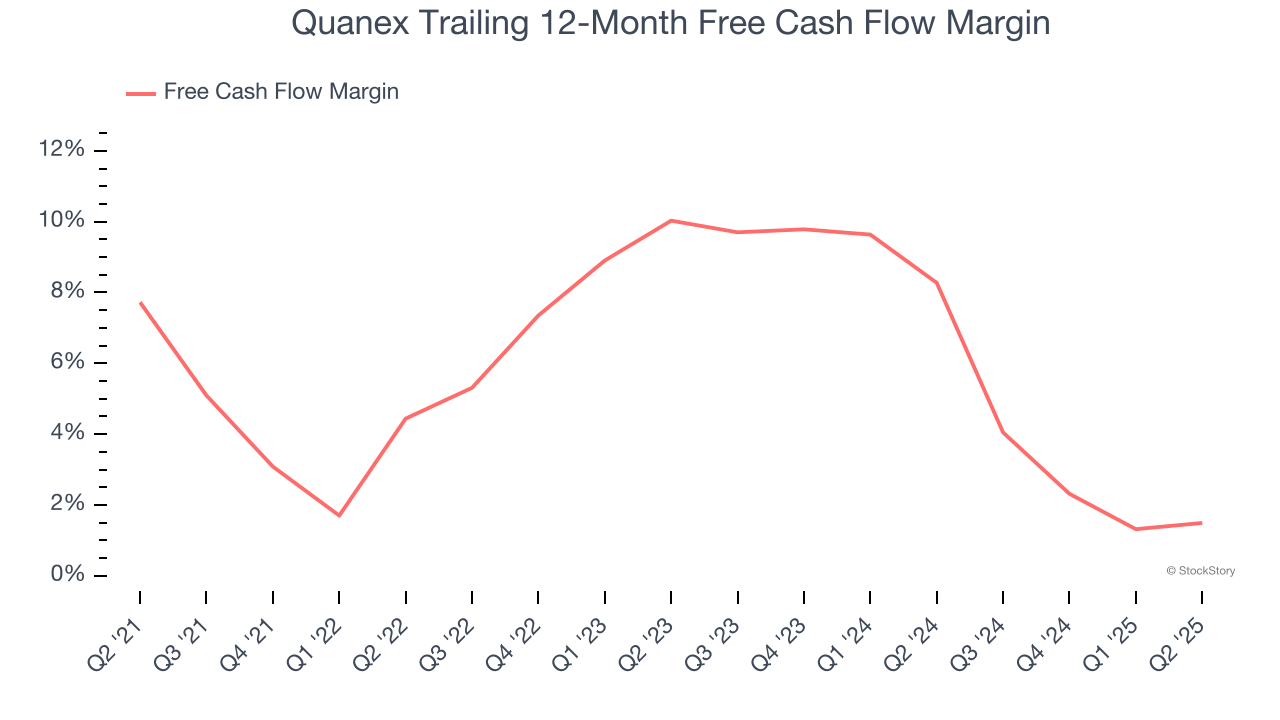
2. Free Cash Flow Margin Dropping
Free cash flow isn't a prominently featured metric in company financials and earnings releases, but we think it's telling because it accounts for all operating and capital expenses, making it tough to manipulate. Cash is king.
As you can see below, Quanex’s margin dropped by 6.2 percentage points over the last five years. This along with its unexciting margin put the company in a tough spot, and shareholders are likely hoping it can reverse course. If the trend continues, it could signal it’s in the middle of a big investment cycle. Quanex’s free cash flow margin for the trailing 12 months was 1.5%.
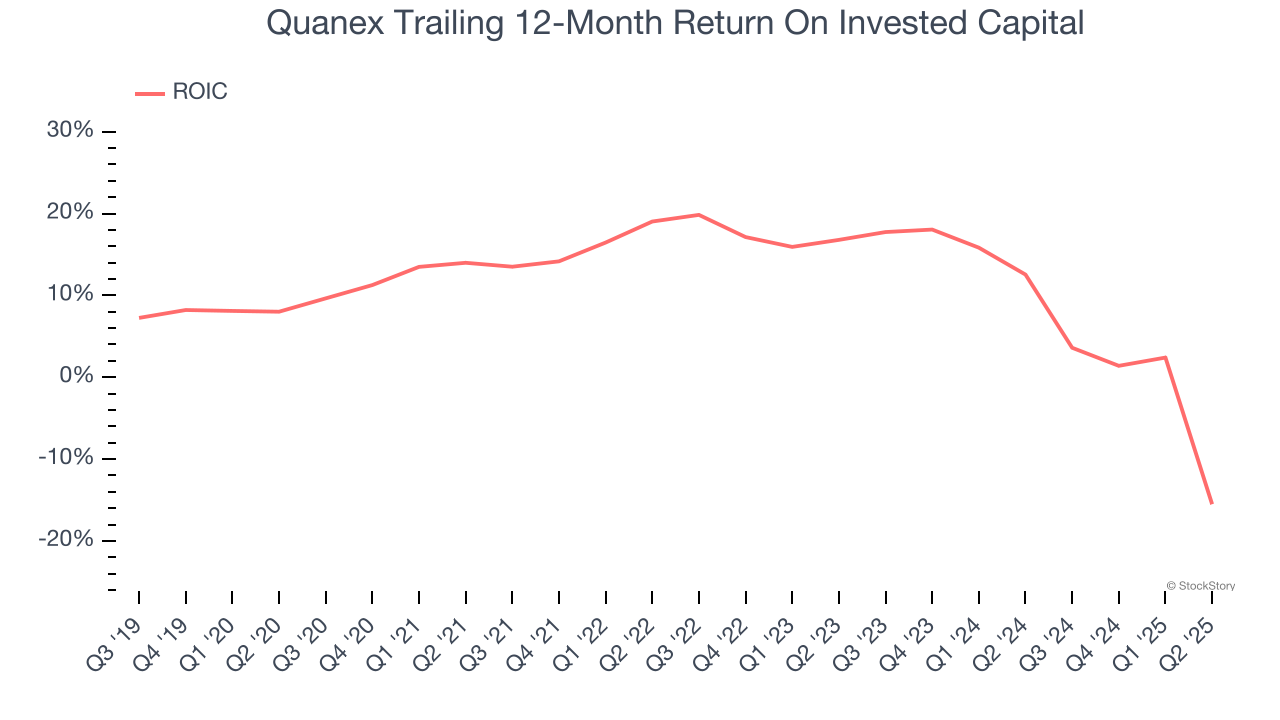
3. New Investments Fail to Bear Fruit as ROIC Declines
ROIC, or return on invested capital, is a metric showing how much operating profit a company generates relative to the money it has raised (debt and equity).
We like to invest in businesses with high returns, but the trend in a company’s ROIC is what often surprises the market and moves the stock price. Unfortunately, Quanex’s ROIC has decreased significantly over the last few years. Paired with its already low returns, these declines suggest its profitable growth opportunities are few and far between.
Final Judgment
Quanex isn’t a terrible business, but it doesn’t pass our quality test. After the recent drawdown, the stock trades at 6.8× forward P/E (or $13.64 per share). While this valuation is optically cheap, the potential downside is big given its shaky fundamentals. We're fairly confident there are better stocks to buy right now. We’d suggest looking at the Amazon and PayPal of Latin America.
Stocks We Would Buy Instead of Quanex
Trump’s April 2025 tariff bombshell triggered a massive market selloff, but stocks have since staged an impressive recovery, leaving those who panic sold on the sidelines.
Take advantage of the rebound by checking out our Top 5 Growth Stocks for this month. This is a curated list of our High Quality stocks that have generated a market-beating return of 183% over the last five years (as of March 31st 2025).
Stocks that made our list in 2020 include now familiar names such as Nvidia (+1,545% between March 2020 and March 2025) as well as under-the-radar businesses like the once-micro-cap company Tecnoglass (+1,754% five-year return). Find your next big winner with StockStory today.
StockStory is growing and hiring equity analyst and marketing roles. Are you a 0 to 1 builder passionate about the markets and AI? See the open roles here.