
Pharmaceutical company Amphastar Pharmaceuticals (NASDAQAMPH) reported revenue ahead of Wall Streets expectations in Q3 CY2025, but sales were flat year on year at $191.8 million. Its non-GAAP profit of $0.93 per share was 12.7% above analysts’ consensus estimates.
Is now the time to buy Amphastar Pharmaceuticals? Find out by accessing our full research report, it’s free for active Edge members.
Amphastar Pharmaceuticals (AMPH) Q3 CY2025 Highlights:
- Revenue: $191.8 million vs analyst estimates of $184.5 million (flat year on year, 4% beat)
- Adjusted EPS: $0.93 vs analyst estimates of $0.83 (12.7% beat)
- Operating Margin: 13.2%, down from 29.8% in the same quarter last year
- Market Capitalization: $1.18 billion
Company Overview
Founded in 1996 and known for its expertise in complex drug formulations, Amphastar Pharmaceuticals (NASDAQ: AMPH) develops and manufactures technically challenging injectable and inhalation medications, including both generic and proprietary pharmaceutical products.
Revenue Growth
A company’s long-term sales performance is one signal of its overall quality. Any business can put up a good quarter or two, but many enduring ones grow for years. Over the last five years, Amphastar Pharmaceuticals grew its sales at a solid 16.5% compounded annual growth rate. Its growth beat the average healthcare company and shows its offerings resonate with customers.
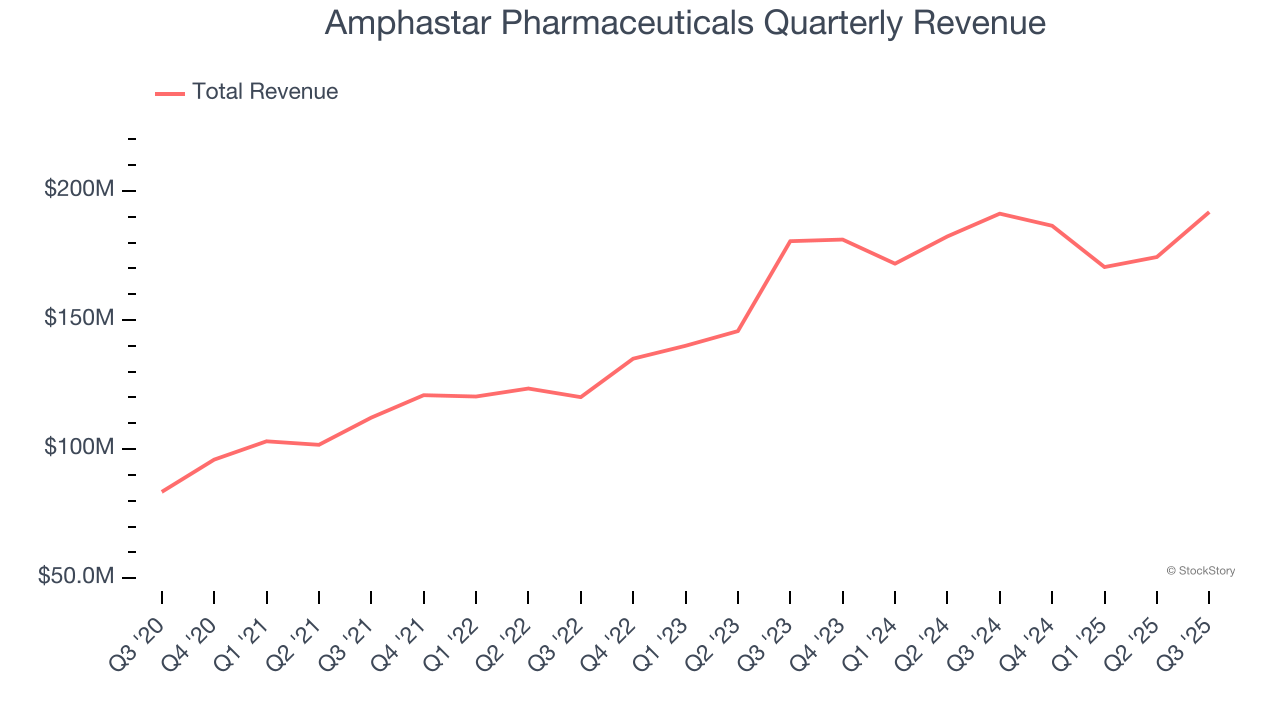
We at StockStory place the most emphasis on long-term growth, but within healthcare, a half-decade historical view may miss recent innovations or disruptive industry trends. Amphastar Pharmaceuticals’s annualized revenue growth of 9.7% over the last two years is below its five-year trend, but we still think the results were respectable. 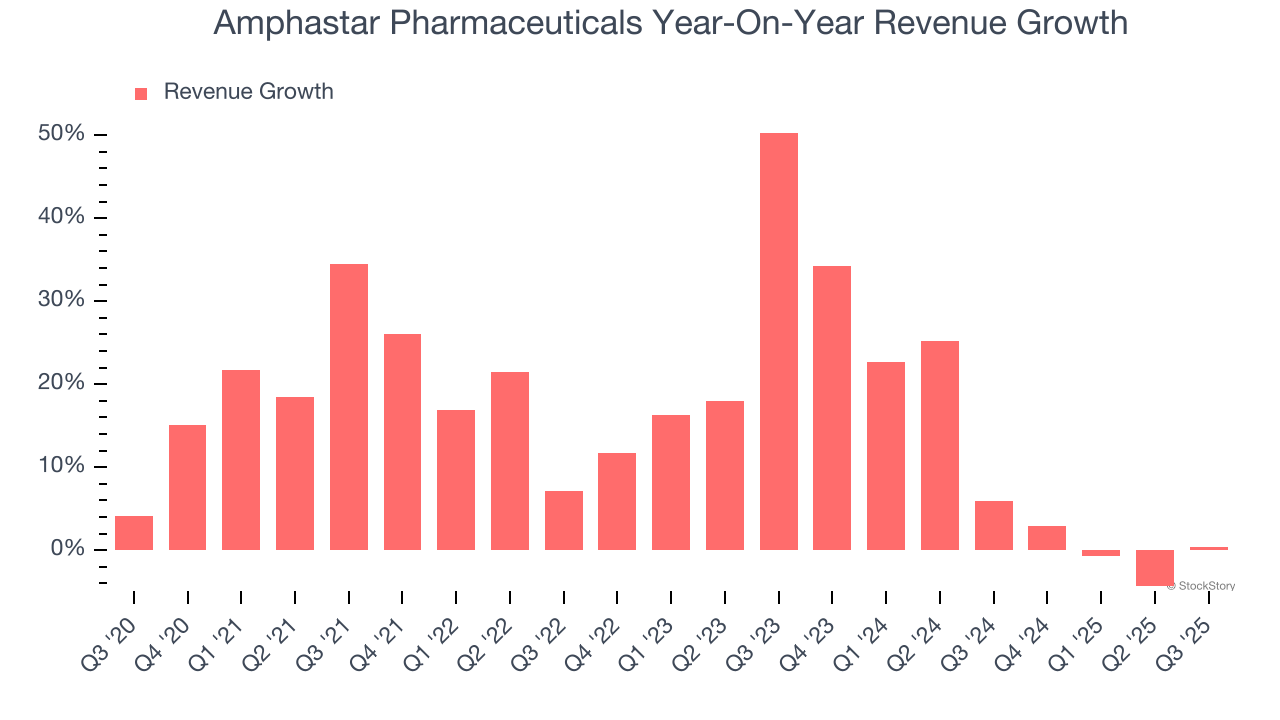
This quarter, Amphastar Pharmaceuticals’s $191.8 million of revenue was flat year on year but beat Wall Street’s estimates by 4%.
Looking ahead, sell-side analysts expect revenue to grow 1.1% over the next 12 months, a deceleration versus the last two years. This projection doesn't excite us and indicates its products and services will see some demand headwinds.
While Wall Street chases Nvidia at all-time highs, an under-the-radar semiconductor supplier is dominating a critical AI component these giants can’t build without. Click here to access our free report one of our favorites growth stories.
Operating Margin
Amphastar Pharmaceuticals has been an efficient company over the last five years. It was one of the more profitable businesses in the healthcare sector, boasting an average operating margin of 23.3%.
Analyzing the trend in its profitability, Amphastar Pharmaceuticals’s operating margin rose by 9 percentage points over the last five years, as its sales growth gave it operating leverage. Zooming into its more recent performance, however, we can see the company’s margin has decreased by 9.3 percentage points on a two-year basis. If Amphastar Pharmaceuticals wants to pass our bar, it must prove it can expand its profitability consistently.
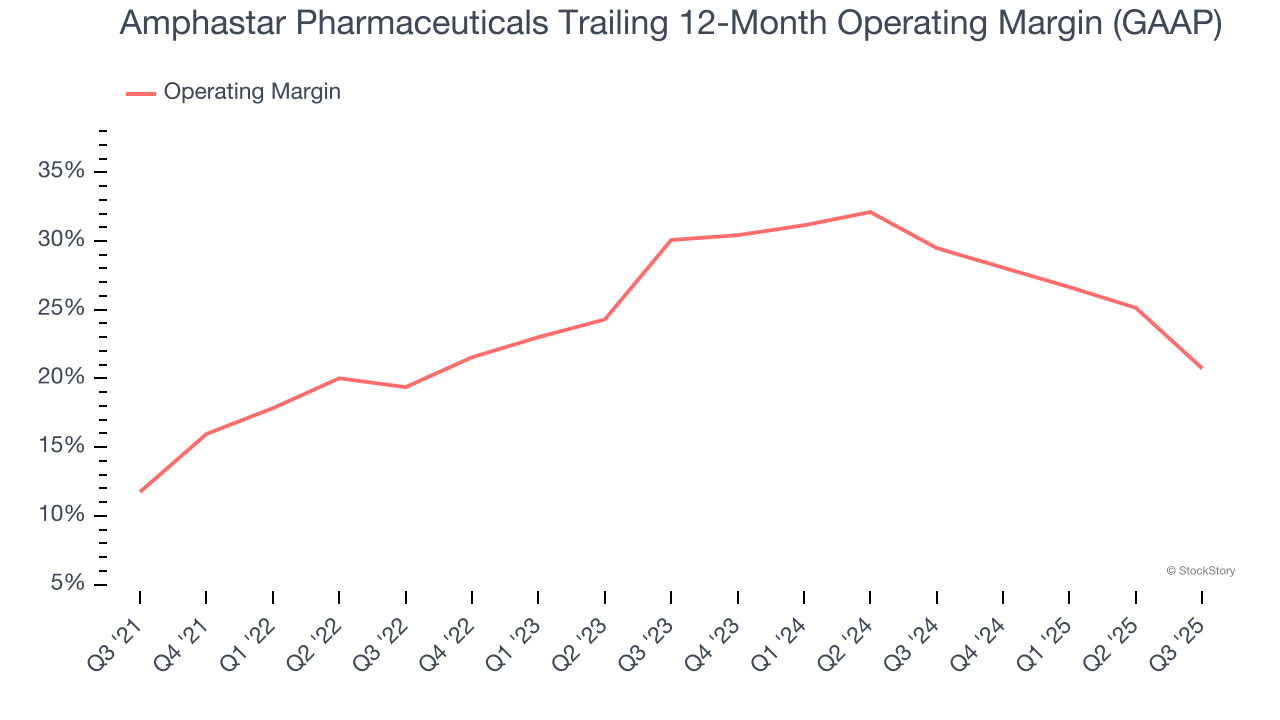
In Q3, Amphastar Pharmaceuticals generated an operating margin profit margin of 13.2%, down 16.6 percentage points year on year. This contraction shows it was less efficient because its expenses increased relative to its revenue.
Earnings Per Share
Revenue trends explain a company’s historical growth, but the long-term change in earnings per share (EPS) points to the profitability of that growth – for example, a company could inflate its sales through excessive spending on advertising and promotions.
Amphastar Pharmaceuticals’s EPS grew at an astounding 49.5% compounded annual growth rate over the last five years, higher than its 16.5% annualized revenue growth. This tells us the company became more profitable on a per-share basis as it expanded.
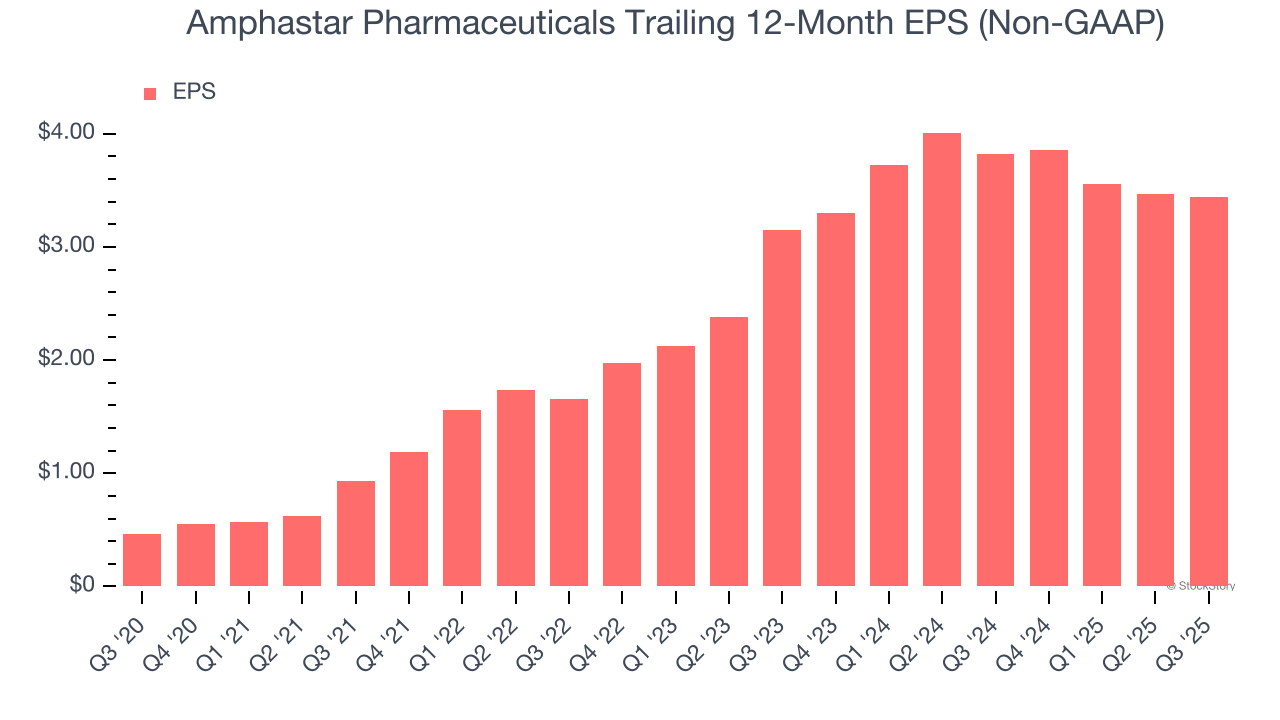
We can take a deeper look into Amphastar Pharmaceuticals’s earnings to better understand the drivers of its performance. As we mentioned earlier, Amphastar Pharmaceuticals’s operating margin declined this quarter but expanded by 9 percentage points over the last five years. Its share count also shrank by 4.4%, and these factors together are positive signs for shareholders because improving profitability and share buybacks turbocharge EPS growth relative to revenue growth. 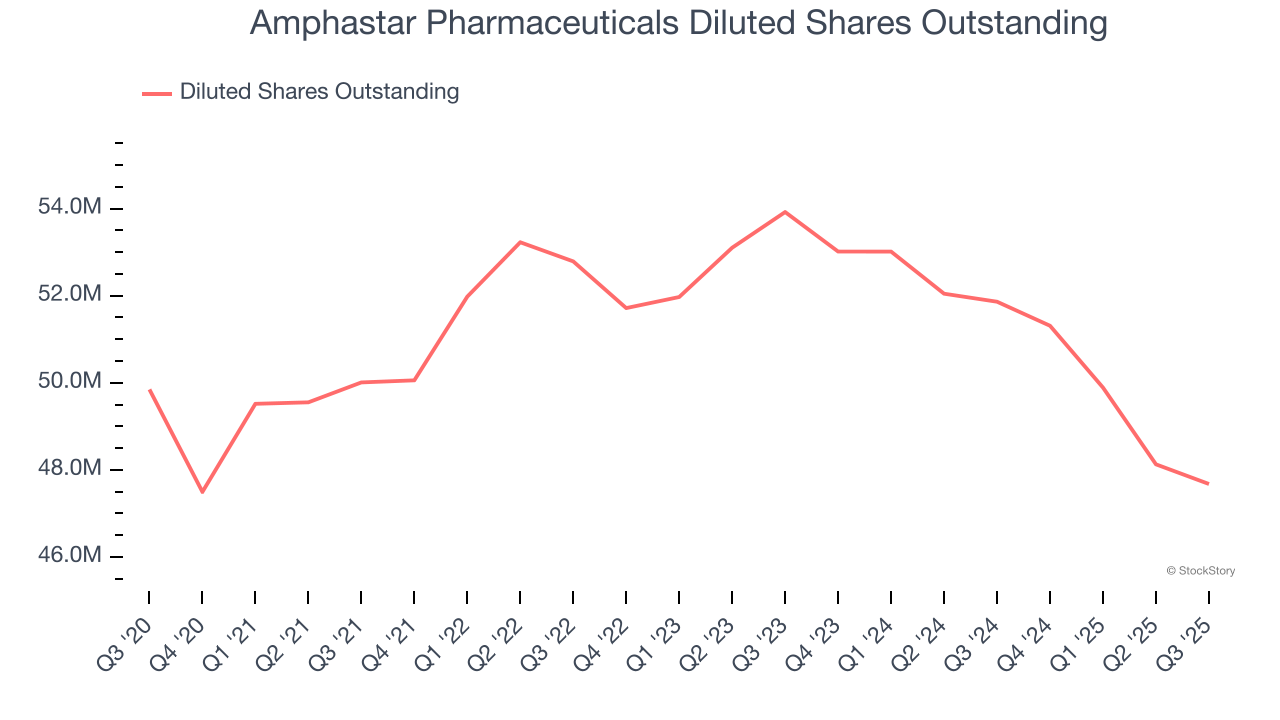
In Q3, Amphastar Pharmaceuticals reported adjusted EPS of $0.93, down from $0.96 in the same quarter last year. Despite falling year on year, this print easily cleared analysts’ estimates. Over the next 12 months, Wall Street expects Amphastar Pharmaceuticals’s full-year EPS of $3.44 to shrink by 2.6%.
Key Takeaways from Amphastar Pharmaceuticals’s Q3 Results
We enjoyed seeing Amphastar Pharmaceuticals beat analysts’ revenue expectations this quarter. We were also glad its EPS outperformed Wall Street’s estimates. Zooming out, we think this quarter featured some important positives. The stock remained flat at $24.23 immediately following the results.
Amphastar Pharmaceuticals may have had a good quarter, but does that mean you should invest right now? If you’re making that decision, you should consider the bigger picture of valuation, business qualities, as well as the latest earnings. We cover that in our actionable full research report which you can read here, it’s free for active Edge members.


