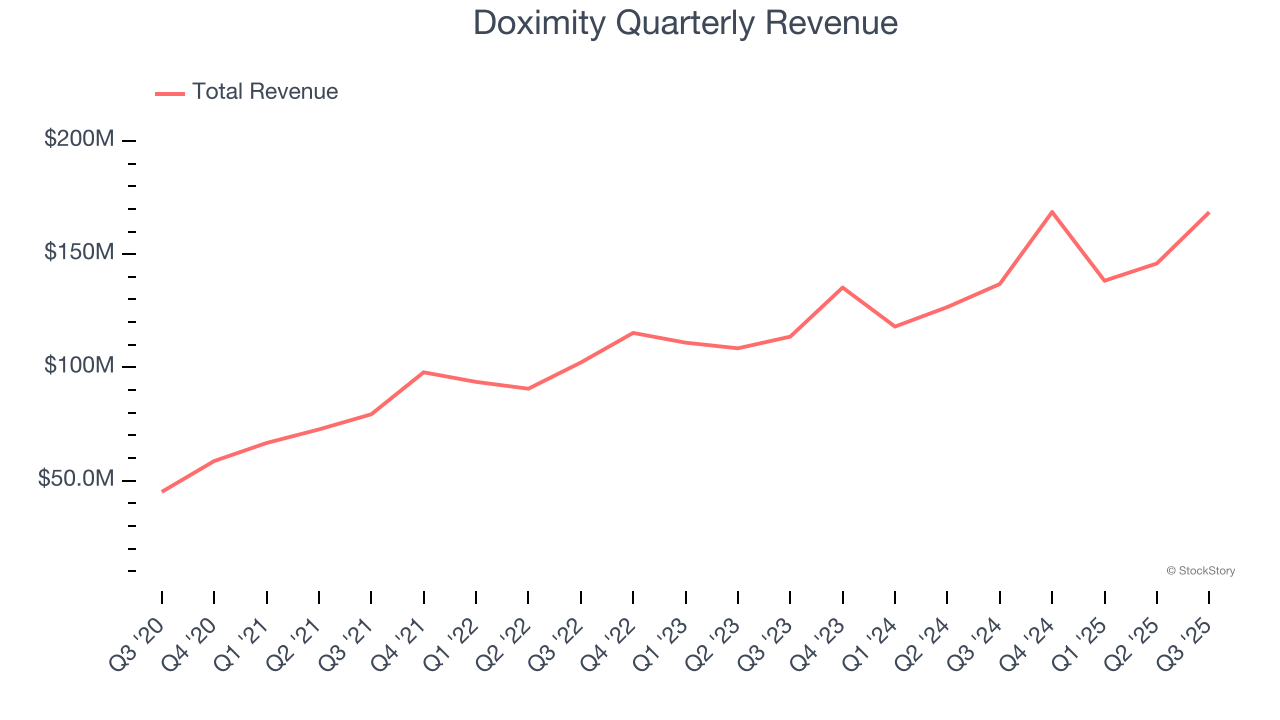
Medical professional network Doximity (NYSE: DOCS) announced better-than-expected revenue in Q3 CY2025, with sales up 23.2% year on year to $168.5 million. The company expects next quarter’s revenue to be around $180.5 million, close to analysts’ estimates. Its non-GAAP profit of $0.45 per share was 18.7% above analysts’ consensus estimates.
Is now the time to buy Doximity? Find out by accessing our full research report, it’s free for active Edge members.
Doximity (DOCS) Q3 CY2025 Highlights:
- Revenue: $168.5 million vs analyst estimates of $157.1 million (23.2% year-on-year growth, 7.2% beat)
- Adjusted EPS: $0.45 vs analyst estimates of $0.38 (18.7% beat)
- Adjusted Operating Income: $98.99 million vs analyst estimates of $85.38 million (58.7% margin, 15.9% beat)
- The company lifted its revenue guidance for the full year to $643 million at the midpoint from $632 million, a 1.7% increase
- EBITDA guidance for the full year is $354 million at the midpoint, above analyst estimates of $348.5 million
- Operating Margin: 37.8%, down from 38.8% in the same quarter last year
- Free Cash Flow Margin: 54.3%, up from 41.2% in the previous quarter
- Market Capitalization: $11.99 billion
“Our platform continues to grow with new AI tools to save physicians’ time,” said Jeff Tangney, co-founder and CEO of Doximity.
Company Overview
With over 80% of U.S. physicians as members of its digital community, Doximity (NYSE: DOCS) operates a digital platform that enables physicians and other healthcare professionals to collaborate, stay current with medical news, manage their careers, and conduct virtual patient visits.
Revenue Growth
A company’s long-term sales performance can indicate its overall quality. Even a bad business can shine for one or two quarters, but a top-tier one grows for years. Thankfully, Doximity’s 32.8% annualized revenue growth over the last five years was excellent. Its growth surpassed the average software company and shows its offerings resonate with customers, a great starting point for our analysis.
We at StockStory place the most emphasis on long-term growth, but within software, a half-decade historical view may miss recent innovations or disruptive industry trends. Doximity’s annualized revenue growth of 17.7% over the last two years is below its five-year trend, but we still think the results suggest healthy demand. 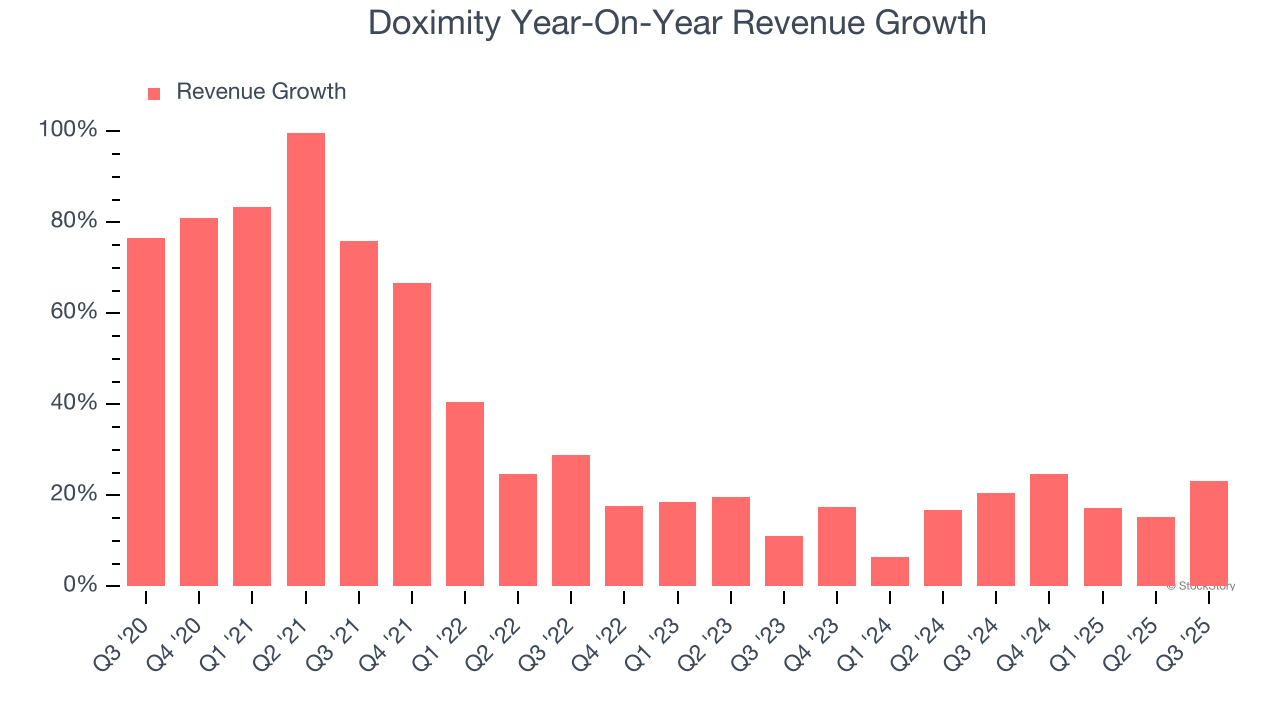
This quarter, Doximity reported robust year-on-year revenue growth of 23.2%, and its $168.5 million of revenue topped Wall Street estimates by 7.2%. Company management is currently guiding for a 7.1% year-on-year increase in sales next quarter.
Looking further ahead, sell-side analysts expect revenue to grow 7% over the next 12 months, a deceleration versus the last two years. This projection is underwhelming and suggests its products and services will face some demand challenges. At least the company is tracking well in other measures of financial health.
While Wall Street chases Nvidia at all-time highs, an under-the-radar semiconductor supplier is dominating a critical AI component these giants can’t build without. Click here to access our free report one of our favorites growth stories.
Customer Acquisition Efficiency
The customer acquisition cost (CAC) payback period represents the months required to recover the cost of acquiring a new customer. Essentially, it’s the break-even point for sales and marketing investments. A shorter CAC payback period is ideal, as it implies better returns on investment and business scalability.
Doximity is extremely efficient at acquiring new customers, and its CAC payback period checked in at 5.3 months this quarter. The company’s rapid recovery of its customer acquisition costs indicates it has a highly differentiated product offering and a strong brand reputation. These dynamics give Doximity more resources to pursue new product initiatives while maintaining the flexibility to increase its sales and marketing investments.
Key Takeaways from Doximity’s Q3 Results
We were impressed by how significantly Doximity blew past analysts’ EBITDA expectations this quarter. We were also glad its revenue outperformed Wall Street’s estimates. On the other hand, its EBITDA guidance for next quarter missed. Overall, we think this was still a solid quarter with some key areas of upside. The market seemed to be hoping for more, and the stock traded down 6.2% to $58.65 immediately after reporting.
Big picture, is Doximity a buy here and now? What happened in the latest quarter matters, but not as much as longer-term business quality and valuation, when deciding whether to invest in this stock. We cover that in our actionable full research report which you can read here, it’s free for active Edge members.