
Aerospace and defense company Ducommun (NYSE: DCO) met Wall Streets revenue expectations in Q3 CY2025, with sales up 5.5% year on year to $212.6 million. Its non-GAAP profit of $0.99 per share was 3.9% above analysts’ consensus estimates.
Is now the time to buy Ducommun? Find out by accessing our full research report, it’s free for active Edge members.
Ducommun (DCO) Q3 CY2025 Highlights:
- Revenue: $212.6 million vs analyst estimates of $212 million (5.5% year-on-year growth, in line)
- Adjusted EPS: $0.99 vs analyst estimates of $0.95 (3.9% beat)
- Adjusted EBITDA: $34.35 million vs analyst estimates of $34.66 million (16.2% margin, 0.9% miss)
- Operating Margin: -37.7%, down from 7.6% in the same quarter last year due to $100 million in non-recurring legal and restructuring charges
- Backlog: $563 million at quarter end, down 46.1% year on year
- Market Capitalization: $1.37 billion
Company Overview
California’s oldest company, Ducommun (NYSE: DCO) is a provider of engineering and manufacturing services for high-performance products primarily within the aerospace and defense industries.
Revenue Growth
A company’s long-term sales performance is one signal of its overall quality. Even a bad business can shine for one or two quarters, but a top-tier one grows for years. Unfortunately, Ducommun’s 4.1% annualized revenue growth over the last five years was sluggish. This fell short of our benchmark for the industrials sector and is a rough starting point for our analysis.
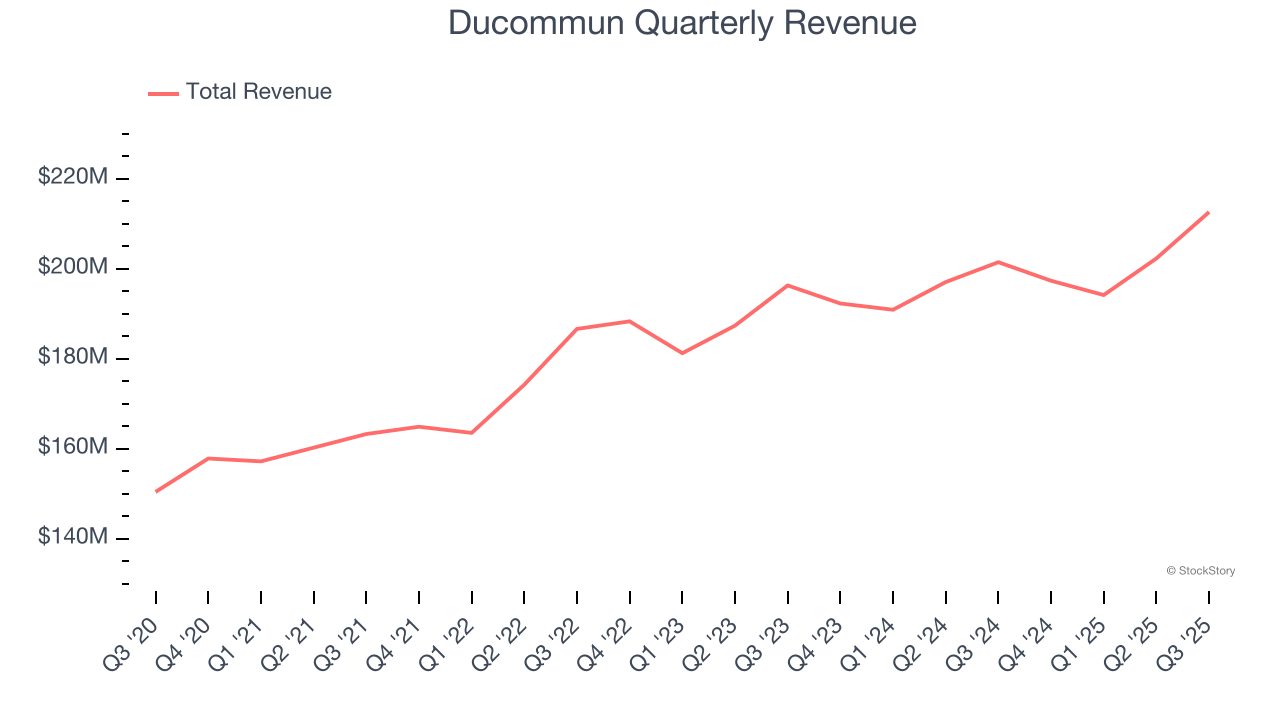
We at StockStory place the most emphasis on long-term growth, but within industrials, a half-decade historical view may miss cycles, industry trends, or a company capitalizing on catalysts such as a new contract win or a successful product line. Ducommun’s annualized revenue growth of 3.5% over the last two years aligns with its five-year trend, suggesting its demand was consistently weak. 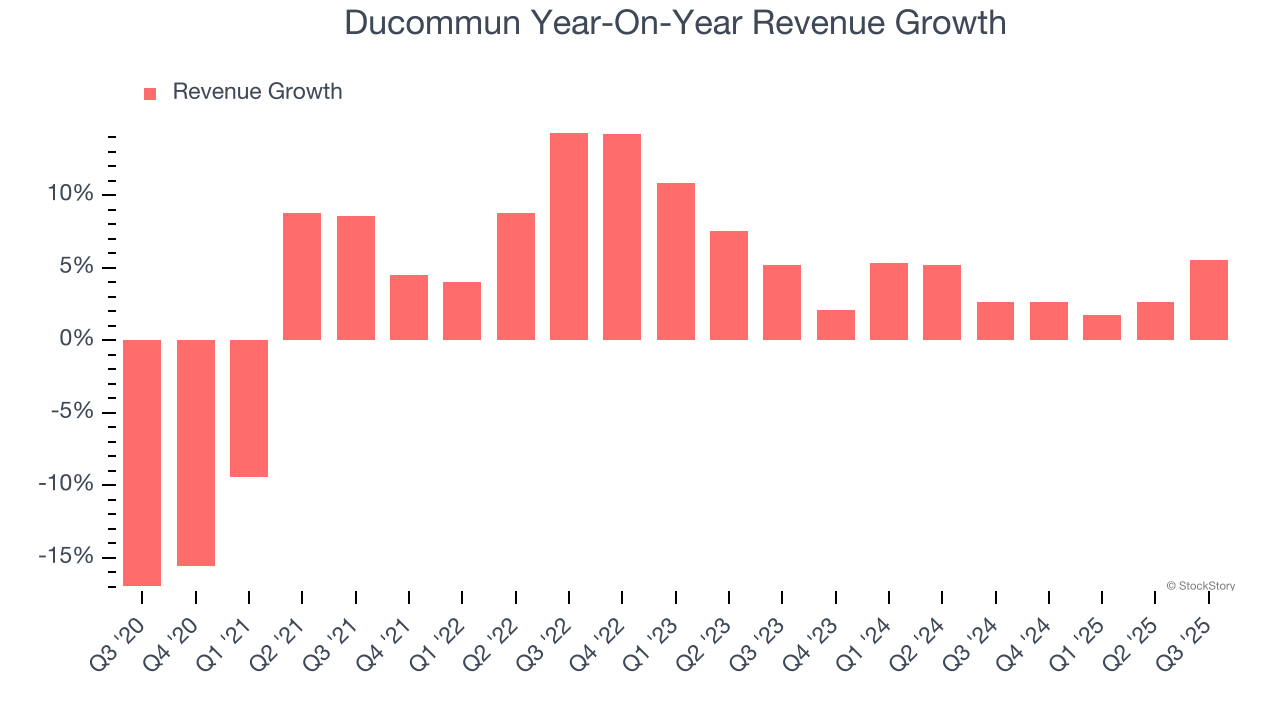
Ducommun also reports its backlog, or the value of its outstanding orders that have not yet been executed or delivered. Ducommun’s backlog reached $563 million in the latest quarter and averaged 2% year-on-year declines over the last two years. Because this number is lower than its revenue growth, we can see the company hasn’t secured enough new orders to maintain its growth rate in the future. 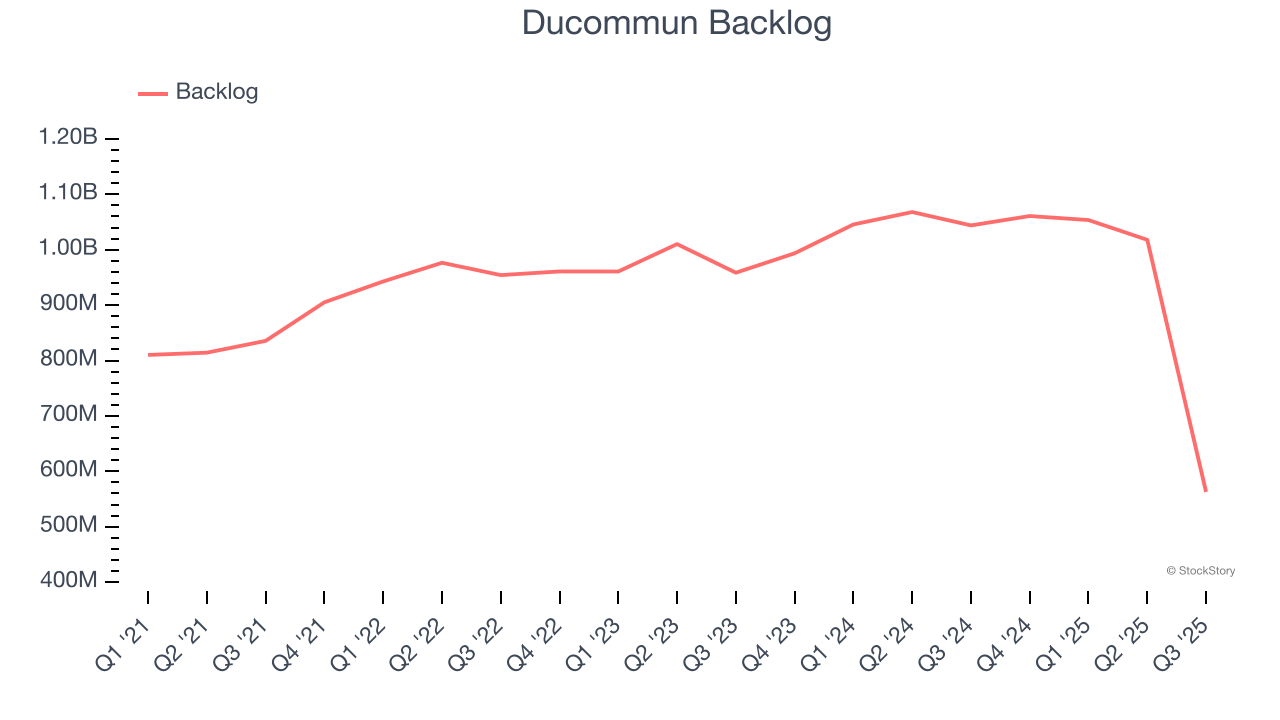
This quarter, Ducommun grew its revenue by 5.5% year on year, and its $212.6 million of revenue was in line with Wall Street’s estimates.
Looking ahead, sell-side analysts expect revenue to grow 9.5% over the next 12 months, an improvement versus the last two years. This projection is noteworthy and suggests its newer products and services will catalyze better top-line performance.
Microsoft, Alphabet, Coca-Cola, Monster Beverage—all began as under-the-radar growth stories riding a massive trend. We’ve identified the next one: a profitable AI semiconductor play Wall Street is still overlooking. Go here for access to our full report.
Operating Margin
Ducommun was profitable over the last five years but held back by its large cost base. Its average operating margin of 3.7% was weak for an industrials business.
Looking at the trend in its profitability, Ducommun’s operating margin decreased by 12.2 percentage points over the last five years. This raises questions about the company’s expense base because its revenue growth should have given it leverage on its fixed costs, resulting in better economies of scale and profitability. Ducommun’s performance was poor no matter how you look at it - it shows that costs were rising and it couldn’t pass them onto its customers.
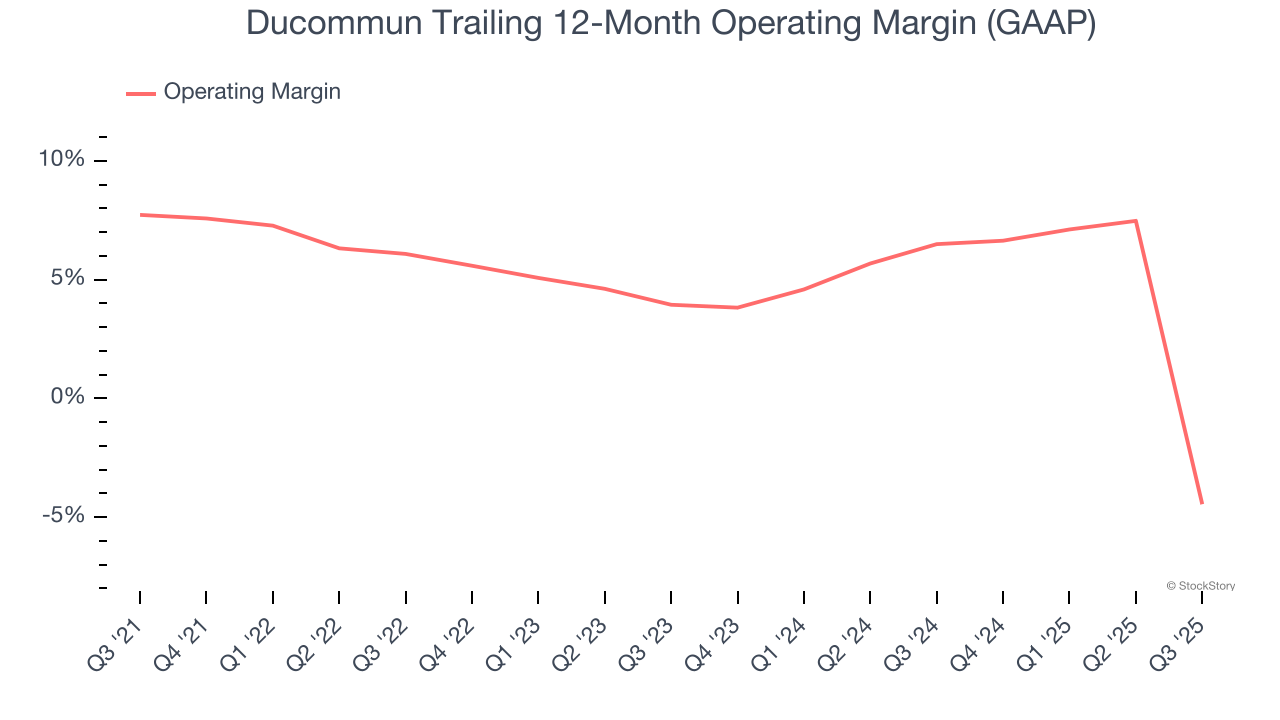
This quarter, Ducommun generated an operating margin profit margin of negative 37.7%, down 45.2 percentage points year on year due to $100 million in non-recurring legal and restructuring charges.
Earnings Per Share
Revenue trends explain a company’s historical growth, but the long-term change in earnings per share (EPS) points to the profitability of that growth – for example, a company could inflate its sales through excessive spending on advertising and promotions.
Ducommun’s unimpressive 5.5% annual EPS growth over the last five years aligns with its revenue performance. This tells us it maintained its per-share profitability as it expanded.
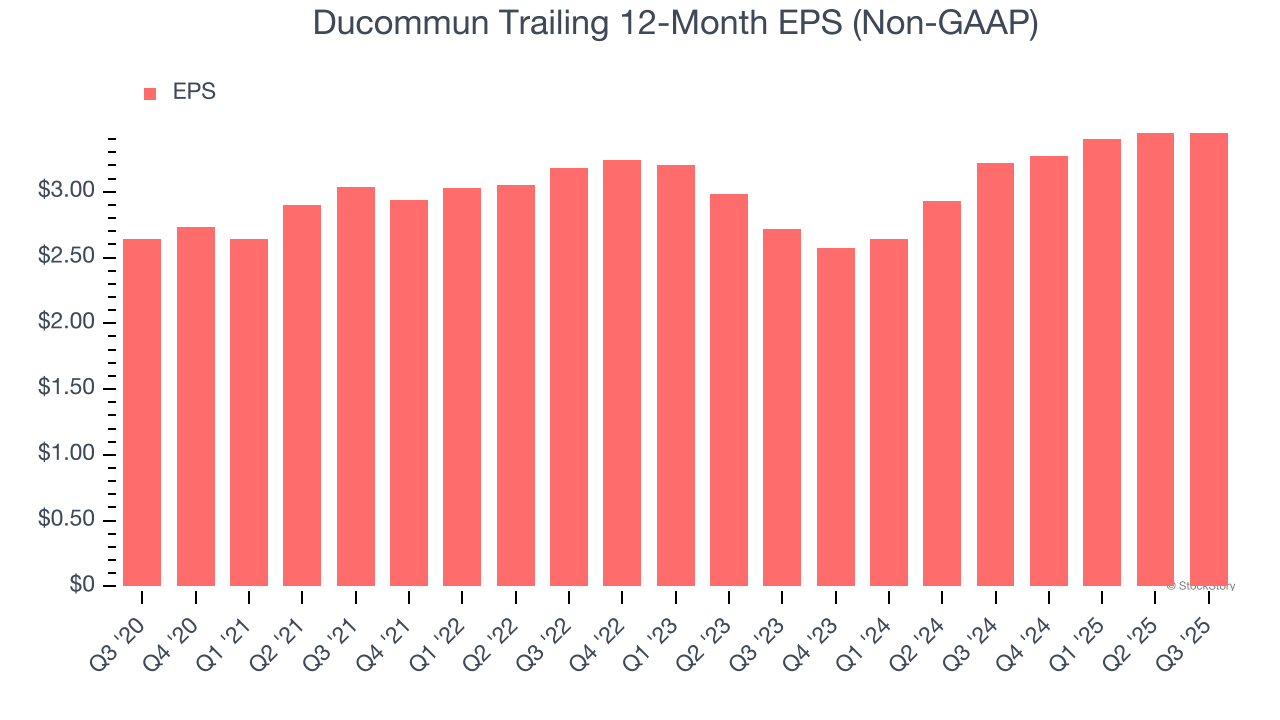
Like with revenue, we analyze EPS over a shorter period to see if we are missing a change in the business.
For Ducommun, its two-year annual EPS growth of 12.6% was higher than its five-year trend. This acceleration made it one of the faster-growing industrials companies in recent history.
In Q3, Ducommun reported adjusted EPS of $0.99, in line with the same quarter last year. This print beat analysts’ estimates by 3.9%. Over the next 12 months, Wall Street expects Ducommun’s full-year EPS of $3.45 to grow 21.4%.
Key Takeaways from Ducommun’s Q3 Results
It was good to see Ducommun beat analysts’ EPS expectations this quarter on in line revenue. On the other hand, its EBITDA slightly missed. Zooming out, we think this was a mixed quarter. The stock traded up 1.8% to $93.81 immediately after reporting.
So should you invest in Ducommun right now? We think that the latest quarter is only one piece of the longer-term business quality puzzle. Quality, when combined with valuation, can help determine if the stock is a buy. We cover that in our actionable full research report which you can read here, it’s free for active Edge members.


