Clothing company Hanesbrands (NYSE: HBI) fell short of the markets revenue expectations in Q3 CY2025, with sales flat year on year at $891.7 million. Its non-GAAP profit of $0.15 per share was 6.7% below analysts’ consensus estimates.
Is now the time to buy Hanesbrands? Find out by accessing our full research report, it’s free for active Edge members.
Hanesbrands (HBI) Q3 CY2025 Highlights:
- Revenue: $891.7 million vs analyst estimates of $901.6 million (flat year on year, 1.1% miss)
- Adjusted EPS: $0.15 vs analyst expectations of $0.16 (6.7% miss)
- Operating Margin: 12.1%, up from 10.4% in the same quarter last year
- Free Cash Flow Margin: 2.5%, down from 9.8% in the same quarter last year
- Constant Currency Revenue was flat year on year (-1.8% in the same quarter last year)
- Market Capitalization: $2.33 billion
“Our top-line results for the quarter reflect an unanticipated late quarter shift in replenishment orders at one of our large U.S. retail partners; however, we saw underlying fundamentals of our business continue to improve in the quarter. Our inventory position at retail is strong. We’re encouraged by our unit point-of-sale trends, which sequentially improved each month during the quarter. We are also pleased with our strong back-to-school season as the Hanes brand continued to gain market share,” said Steve Bratspies, CEO.
Company Overview
A classic American staple founded in 1901, Hanesbrands (NYSE: HBI) is a clothing company known for its array of basic apparel including innerwear and activewear.
Revenue Growth
A company’s long-term sales performance is one signal of its overall quality. Any business can put up a good quarter or two, but the best consistently grow over the long haul. Over the last five years, Hanesbrands’s demand was weak and its revenue declined by 10.6% per year. This was below our standards and is a sign of poor business quality.
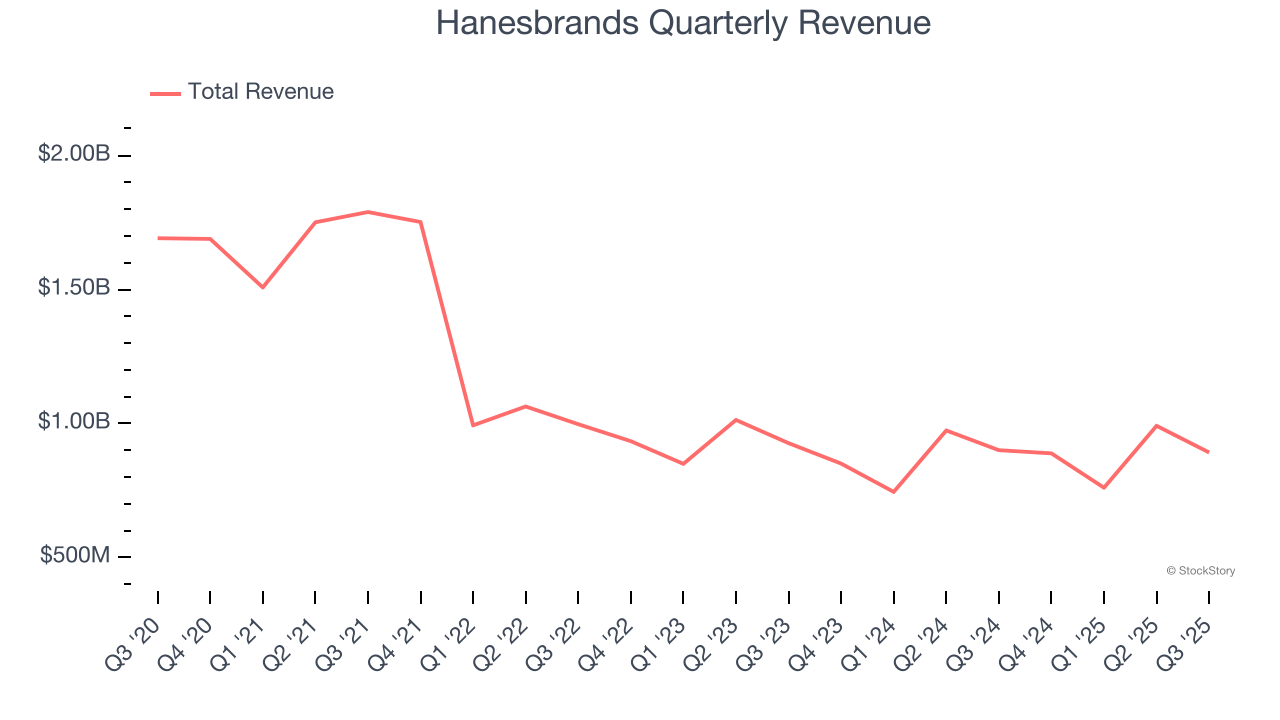
We at StockStory place the most emphasis on long-term growth, but within consumer discretionary, a stretched historical view may miss a company riding a successful new product or trend. Hanesbrands’s annualized revenue declines of 2.6% over the last two years suggest its demand continued shrinking. 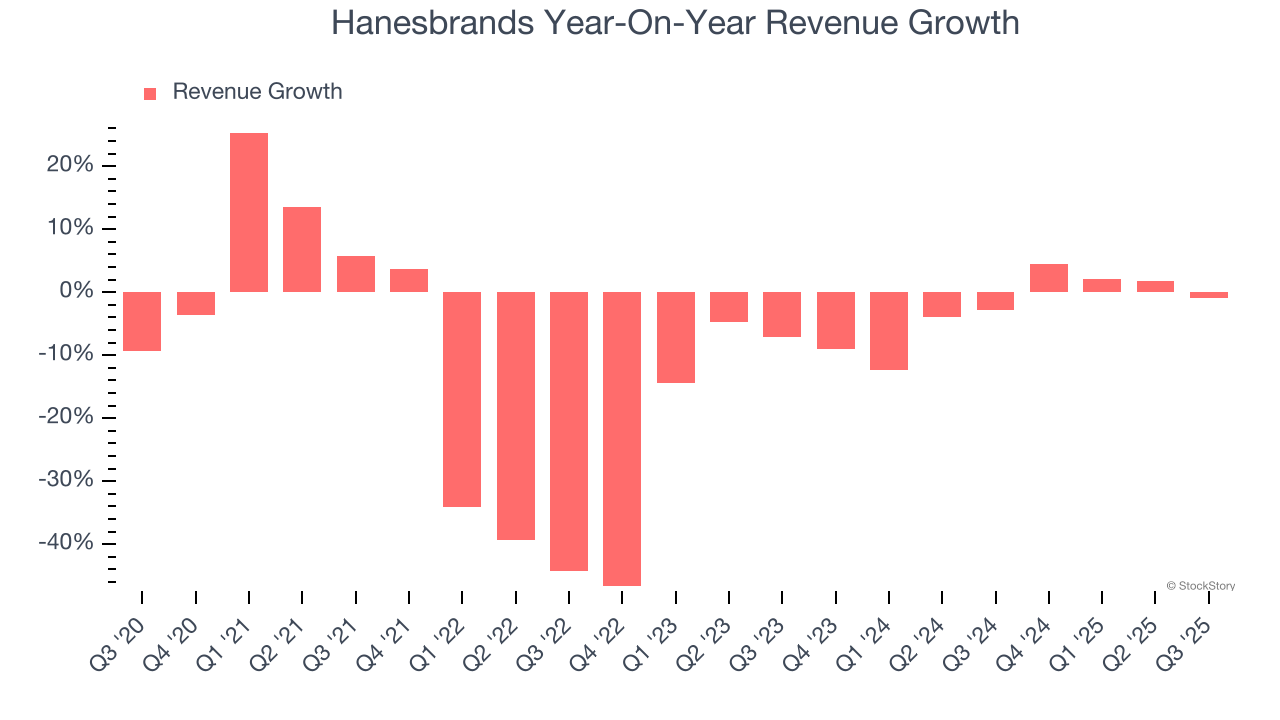
We can dig further into the company’s sales dynamics by analyzing its constant currency revenue, which excludes currency movements that are outside their control and not indicative of demand. Over the last two years, its constant currency sales averaged 2.5% year-on-year declines. Because this number aligns with its normal revenue growth, we can see that Hanesbrands has properly hedged its foreign currency exposure. 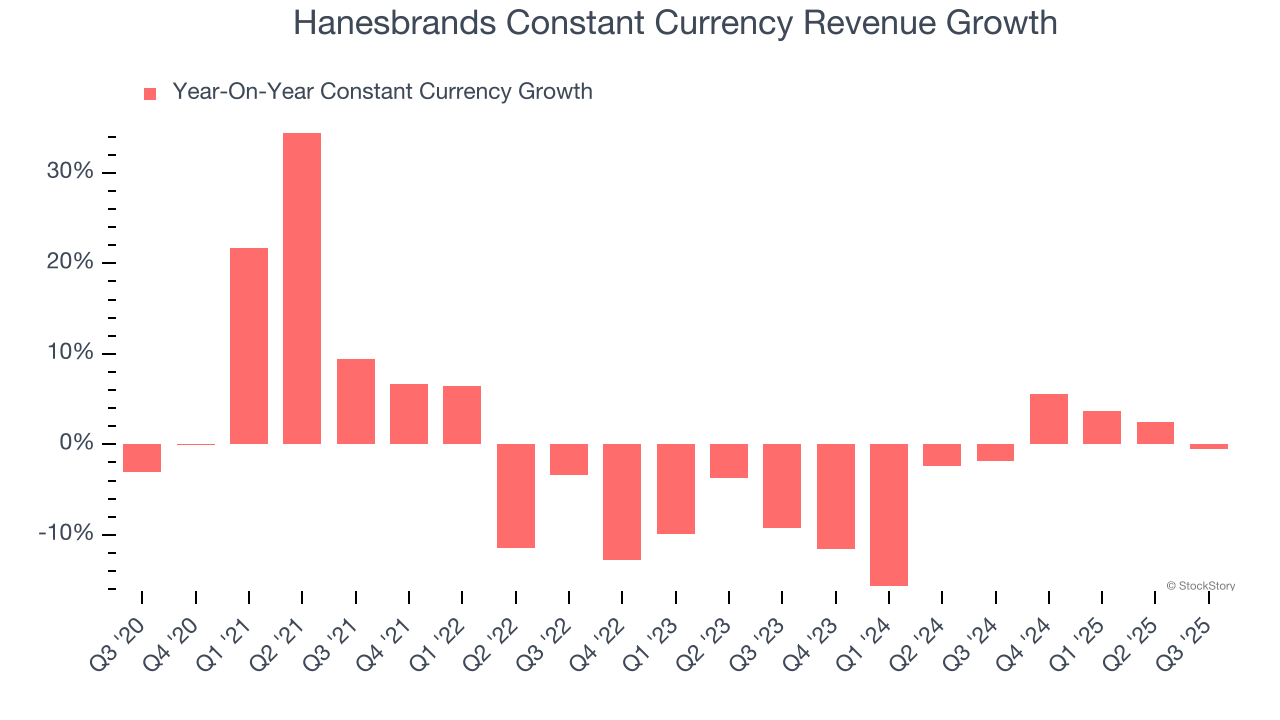
This quarter, Hanesbrands missed Wall Street’s estimates and reported a rather uninspiring 1% year-on-year revenue decline, generating $891.7 million of revenue.
Looking ahead, sell-side analysts expect revenue to remain flat over the next 12 months. While this projection suggests its newer products and services will catalyze better top-line performance, it is still below average for the sector.
The 1999 book Gorilla Game predicted Microsoft and Apple would dominate tech before it happened. Its thesis? Identify the platform winners early. Today, enterprise software companies embedding generative AI are becoming the new gorillas. a profitable, fast-growing enterprise software stock that is already riding the automation wave and looking to catch the generative AI next.
Operating Margin
Operating margin is a key measure of profitability. Think of it as net income - the bottom line - excluding the impact of taxes and interest on debt, which are less connected to business fundamentals.
Hanesbrands’s operating margin has been trending up over the last 12 months and averaged 8.9% over the last two years. The company’s higher efficiency is a breath of fresh air, but its suboptimal cost structure means it still sports mediocre profitability for a consumer discretionary business.
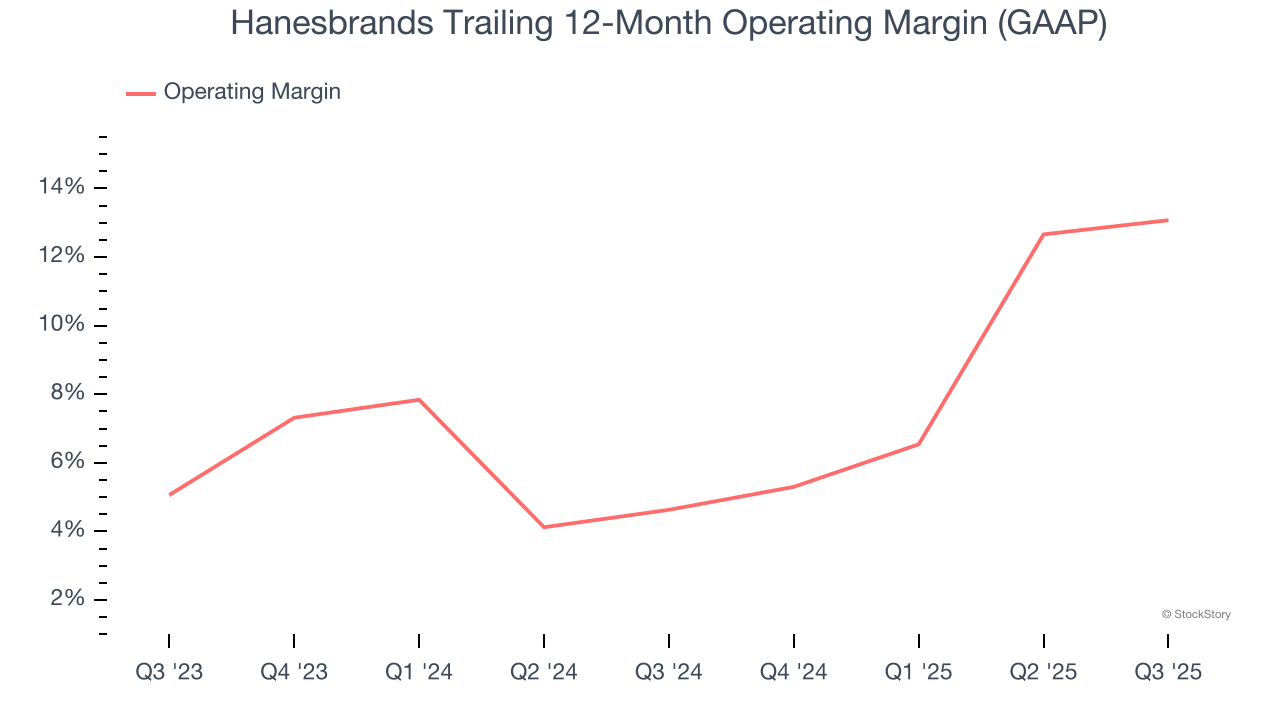
This quarter, Hanesbrands generated an operating margin profit margin of 12.1%, up 1.6 percentage points year on year. This increase was a welcome development and shows it was more efficient.
Earnings Per Share
Revenue trends explain a company’s historical growth, but the long-term change in earnings per share (EPS) points to the profitability of that growth – for example, a company could inflate its sales through excessive spending on advertising and promotions.
Sadly for Hanesbrands, its EPS declined by 16.8% annually over the last five years, more than its revenue. This tells us the company struggled because its fixed cost base made it difficult to adjust to shrinking demand.
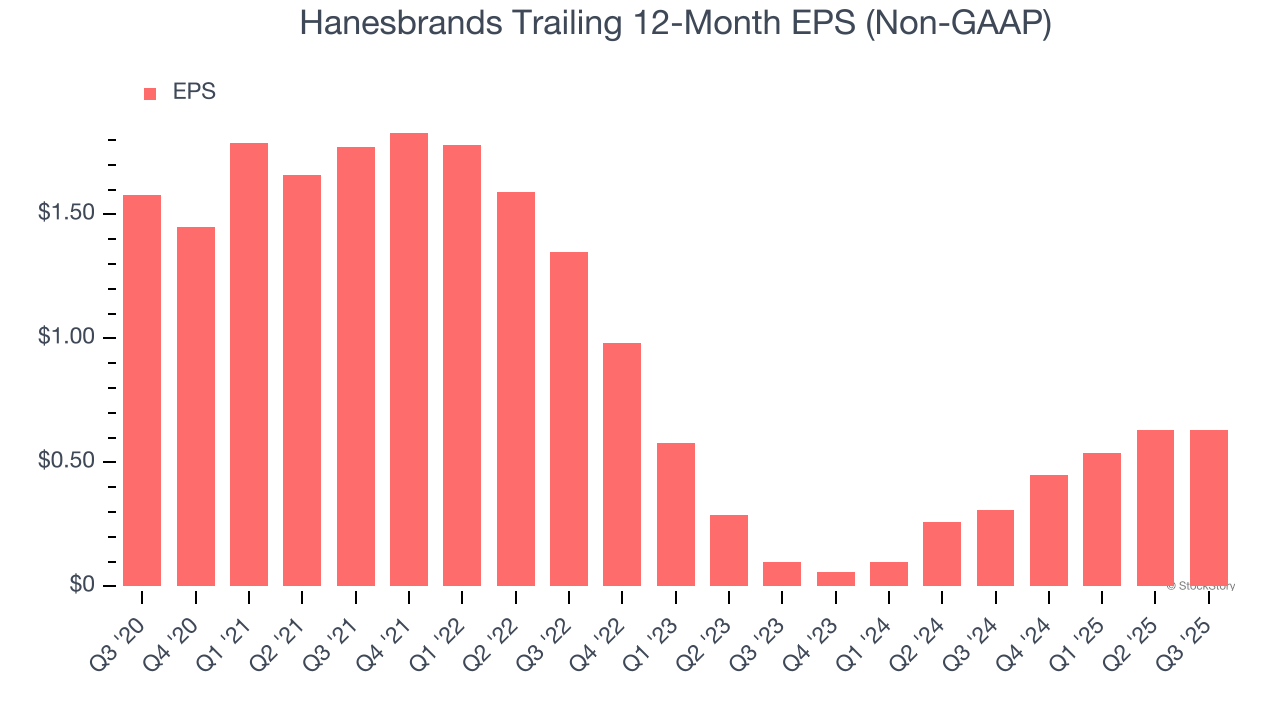
In Q3, Hanesbrands reported adjusted EPS of $0.15, in line with the same quarter last year. This print missed analysts’ estimates. Over the next 12 months, Wall Street expects Hanesbrands’s full-year EPS of $0.63 to grow 5.9%.
Key Takeaways from Hanesbrands’s Q3 Results
We were impressed by how significantly Hanesbrands blew past analysts’ constant currency revenue expectations this quarter. On the other hand, its EPS missed and its revenue fell slightly short of Wall Street’s estimates. Overall, this was a softer quarter. The stock remained flat at $6.59 immediately after reporting.
Big picture, is Hanesbrands a buy here and now? When making that decision, it’s important to consider its valuation, business qualities, as well as what has happened in the latest quarter. We cover that in our actionable full research report which you can read here, it’s free for active Edge members.