The past six months have been a windfall for Incyte’s shareholders. The company’s stock price has jumped 78.7%, setting a new 52-week high of $106.50 per share. This was partly due to its solid quarterly results, and the performance may have investors wondering how to approach the situation.
Is now still a good time to buy INCY? Or is this a case of a company fueled by heightened investor enthusiasm? Find out in our full research report, it’s free for active Edge members.
Why Does INCY Stock Spark Debate?
Founded in 1991 and evolving from a genomics research firm to a commercial-stage drug developer, Incyte (NASDAQ: INCY) is a biopharmaceutical company that discovers, develops, and commercializes proprietary therapeutics for cancer and inflammatory diseases.
Two Things to Like:
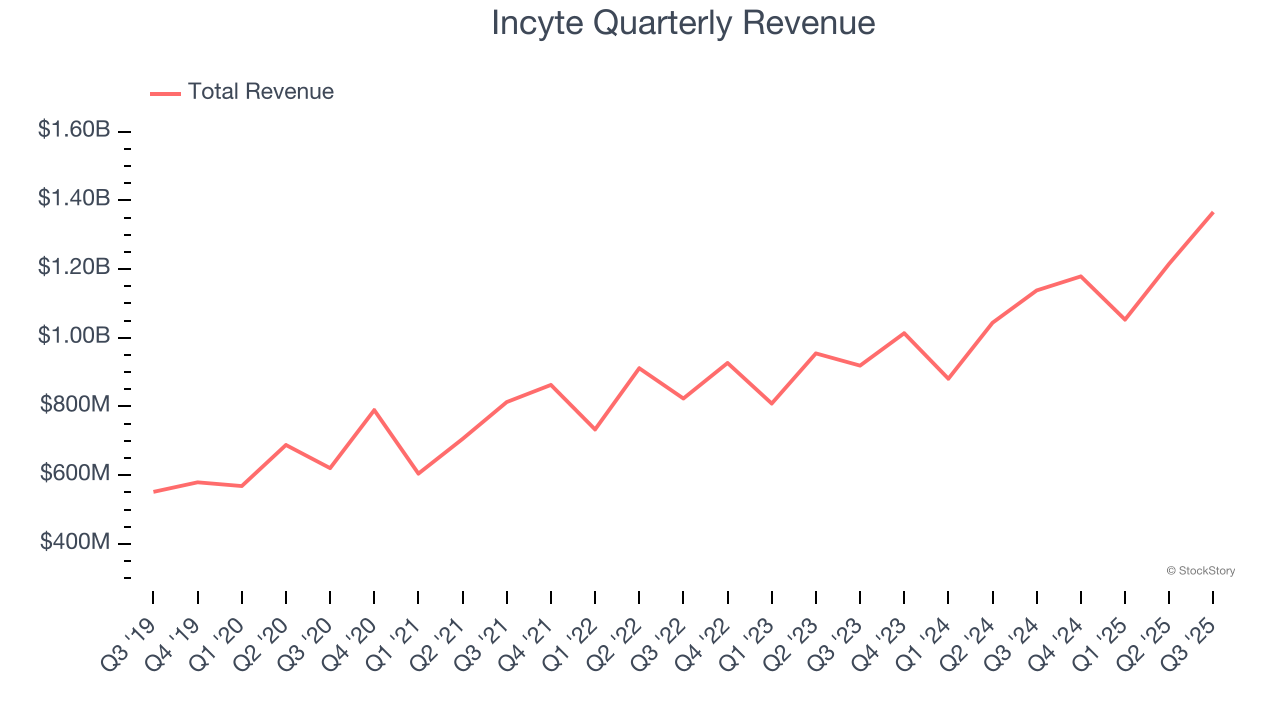
1. Long-Term Revenue Growth Shows Strong Momentum
A company’s long-term sales performance is one signal of its overall quality. Any business can put up a good quarter or two, but the best consistently grow over the long haul. Luckily, Incyte’s sales grew at a solid 14.4% compounded annual growth rate over the last five years. Its growth beat the average healthcare company and shows its offerings resonate with customers.
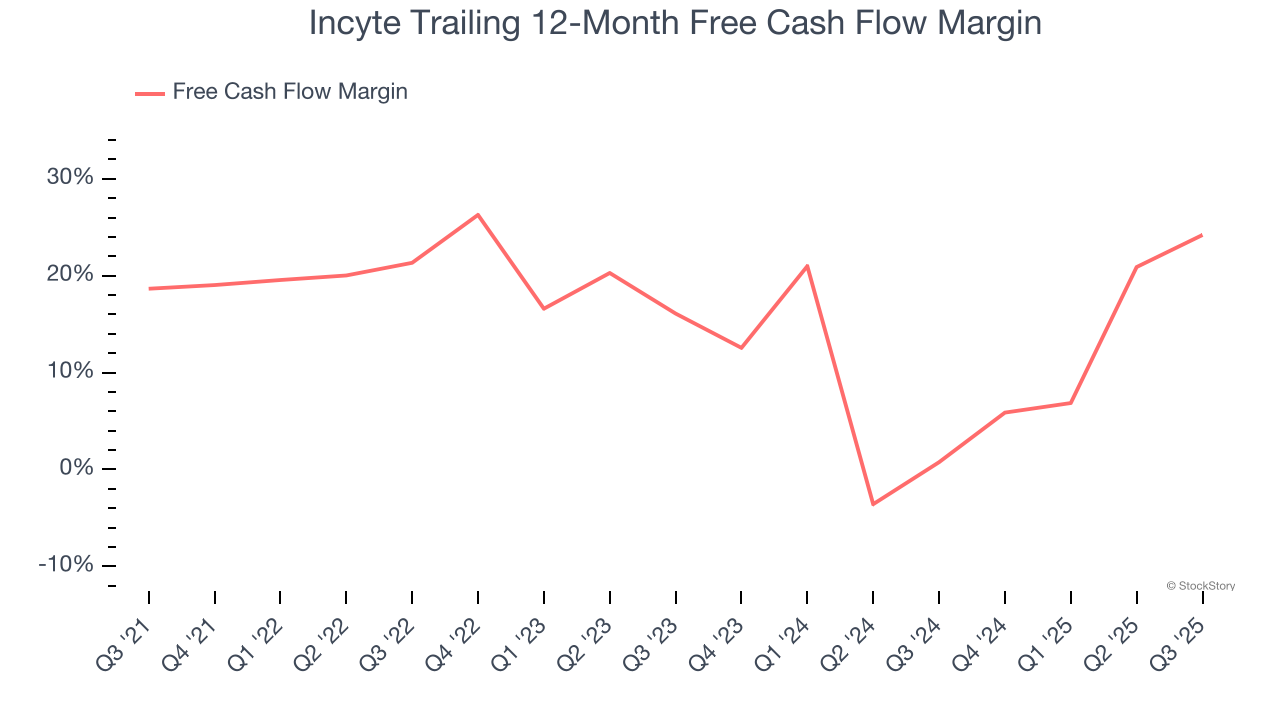
2. Increasing Free Cash Flow Margin Juices Financials
Free cash flow isn't a prominently featured metric in company financials and earnings releases, but we think it's telling because it accounts for all operating and capital expenses, making it tough to manipulate. Cash is king.
As you can see below, Incyte’s margin expanded by 5.5 percentage points over the last five years. This is encouraging, and we can see it became a less capital-intensive business because its free cash flow profitability rose more than its operating profitability. Incyte’s free cash flow margin for the trailing 12 months was 24.2%.
One Reason to be Careful:
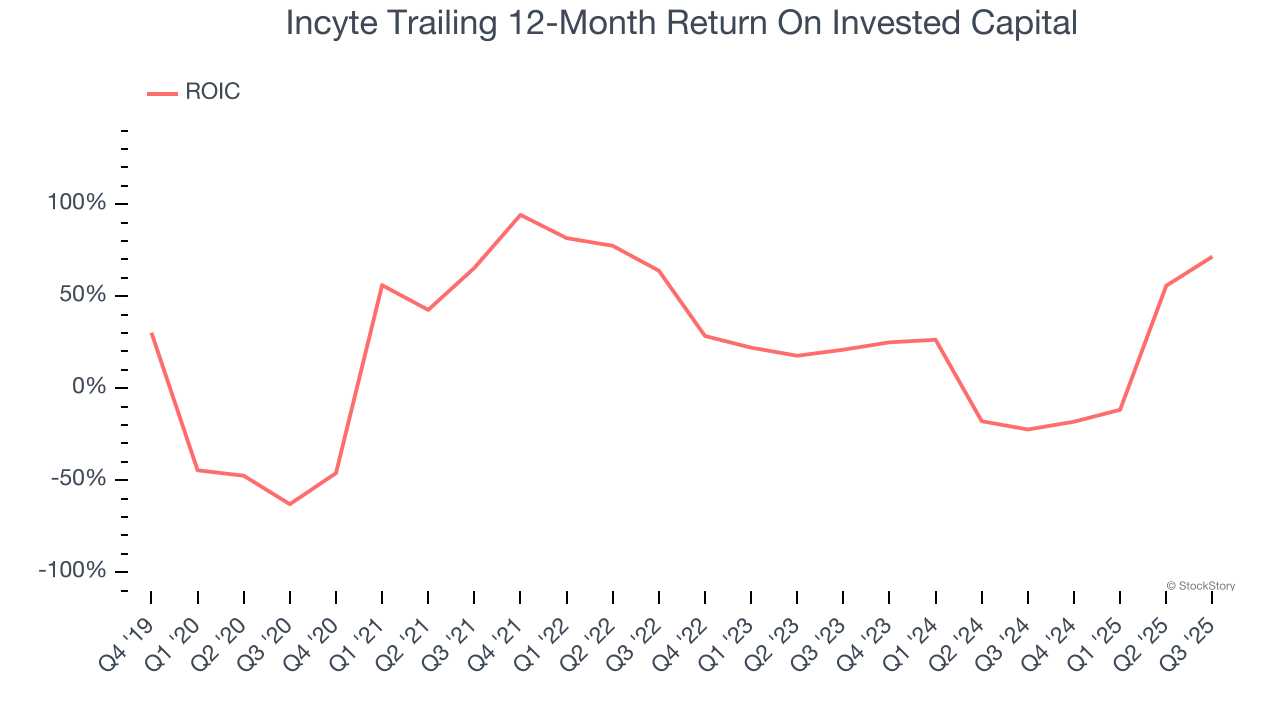
New Investments Fail to Bear Fruit as ROIC Declines
ROIC, or return on invested capital, is a metric showing how much operating profit a company generates relative to the money it has raised (debt and equity).
We like to invest in businesses with high returns, but the trend in a company’s ROIC is what often surprises the market and moves the stock price. Unfortunately, Incyte’s ROIC has decreased significantly over the last few years. Only time will tell if its new bets can bear fruit and potentially reverse the trend.
Final Judgment
Incyte has huge potential even though it has some open questions, and after the recent rally, the stock trades at 14× forward P/E (or $106.50 per share). Is now a good time to buy despite the apparent froth? See for yourself in our comprehensive research report, it’s free for active Edge members .
Stocks We Like Even More Than Incyte
Donald Trump’s April 2025 "Liberation Day" tariffs sent markets into a tailspin, but stocks have since rebounded strongly, proving that knee-jerk reactions often create the best buying opportunities.
The smart money is already positioning for the next leg up. Don’t miss out on the recovery - check out our Top 9 Market-Beating Stocks. This is a curated list of our High Quality stocks that have generated a market-beating return of 183% over the last five years (as of March 31st 2025).
Stocks that made our list in 2020 include now familiar names such as Nvidia (+1,545% between March 2020 and March 2025) as well as under-the-radar businesses like the once-small-cap company Exlservice (+354% five-year return). Find your next big winner with StockStory today.
StockStory is growing and hiring equity analyst and marketing roles. Are you a 0 to 1 builder passionate about the markets and AI? See the open roles here.