Self-storage and building solutions company Janus (NYSE: JBI) fell short of the markets revenue expectations in Q3 CY2025, with sales falling 4.7% year on year to $219.3 million. The company’s full-year revenue guidance of $875 million at the midpoint came in 1% below analysts’ estimates. Its non-GAAP profit of $0.16 per share was 22% below analysts’ consensus estimates.
Is now the time to buy Janus? Find out by accessing our full research report, it’s free for active Edge members.
Janus (JBI) Q3 CY2025 Highlights:
- Revenue: $219.3 million vs analyst estimates of $228.3 million (4.7% year-on-year decline, 3.9% miss)
- Adjusted EPS: $0.16 vs analyst expectations of $0.21 (22% miss)
- Adjusted EBITDA: $43.6 million vs analyst estimates of $50.02 million (19.9% margin, 12.8% miss)
- The company reconfirmed its revenue guidance for the full year of $875 million at the midpoint
- EBITDA guidance for the full year is $167 million at the midpoint, below analyst estimates of $184.9 million
- Operating Margin: 13.4%, up from 11.6% in the same quarter last year
- Free Cash Flow Margin: 3.8%, down from 17.1% in the same quarter last year
- Market Capitalization: $1.29 billion
Ramey Jackson, Chief Executive Officer, stated, “Our team continues to execute in an environment that remains challenging, maintaining focus on operational excellence while positioning the business for long-term success. Supported by our balance sheet and cash flow foundation, we will continue to develop our suite of solutions to further build upon our market leadership position and invest for future growth.”
Company Overview
Standing out with its digital keyless entry into self-storage room technology, Janus (NYSE: JBI) is a provider of easily accessible self-storage solutions.
Revenue Growth
A company’s long-term sales performance can indicate its overall quality. Even a bad business can shine for one or two quarters, but a top-tier one grows for years. Over the last five years, Janus grew its sales at a solid 10.4% compounded annual growth rate. Its growth beat the average industrials company and shows its offerings resonate with customers.
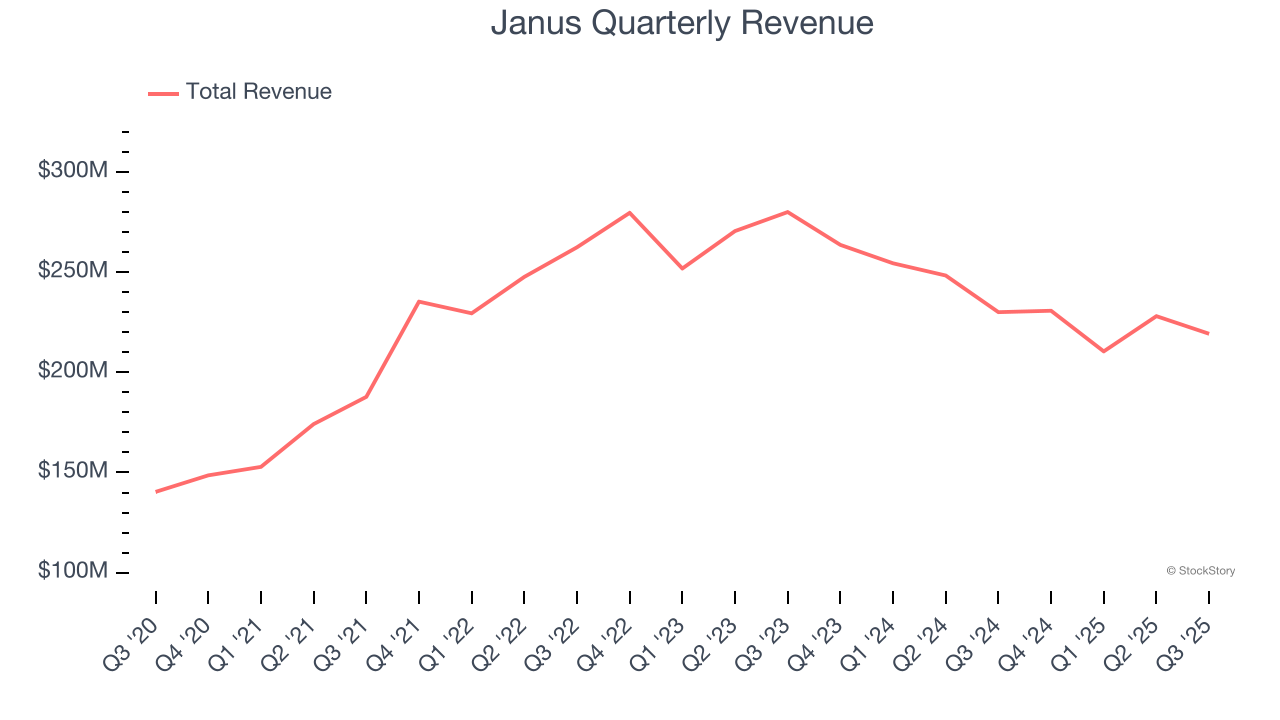
We at StockStory place the most emphasis on long-term growth, but within industrials, a half-decade historical view may miss cycles, industry trends, or a company capitalizing on catalysts such as a new contract win or a successful product line. Janus’s recent performance marks a sharp pivot from its five-year trend as its revenue has shown annualized declines of 9.4% over the last two years. 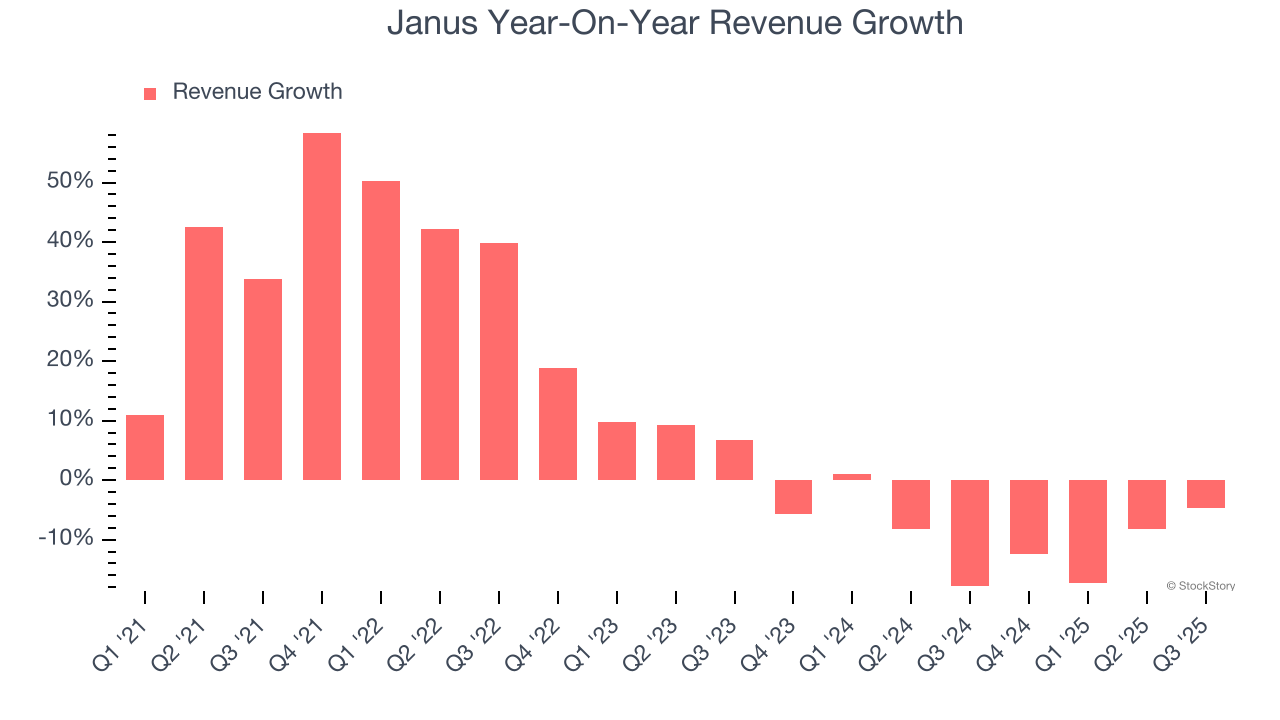
This quarter, Janus missed Wall Street’s estimates and reported a rather uninspiring 4.7% year-on-year revenue decline, generating $219.3 million of revenue.
Looking ahead, sell-side analysts expect revenue to grow 1.9% over the next 12 months. While this projection suggests its newer products and services will catalyze better top-line performance, it is still below average for the sector.
While Wall Street chases Nvidia at all-time highs, an under-the-radar semiconductor supplier is dominating a critical AI component these giants can’t build without. Click here to access our free report one of our favorites growth stories.
Operating Margin
Operating margin is a key measure of profitability. Think of it as net income - the bottom line - excluding the impact of taxes and interest on debt, which are less connected to business fundamentals.
Janus has been a well-oiled machine over the last five years. It demonstrated elite profitability for an industrials business, boasting an average operating margin of 17%. This result isn’t surprising as its high gross margin gives it a favorable starting point.
Looking at the trend in its profitability, Janus’s operating margin decreased by 1.2 percentage points over the last five years. This raises questions about the company’s expense base because its revenue growth should have given it leverage on its fixed costs, resulting in better economies of scale and profitability.
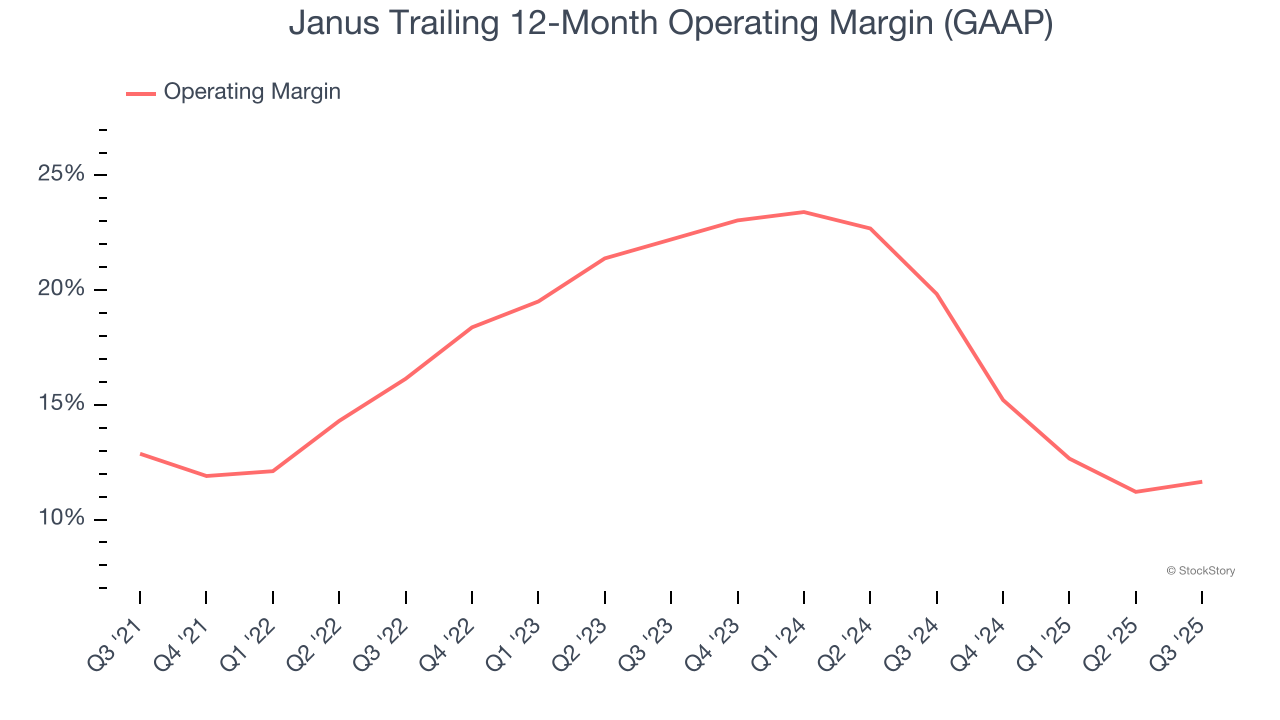
This quarter, Janus generated an operating margin profit margin of 13.4%, up 1.8 percentage points year on year. The increase was encouraging, and because its operating margin rose more than its gross margin, we can infer it was more efficient with expenses such as marketing, R&D, and administrative overhead.
Earnings Per Share
Revenue trends explain a company’s historical growth, but the change in earnings per share (EPS) points to the profitability of that growth – for example, a company could inflate its sales through excessive spending on advertising and promotions.
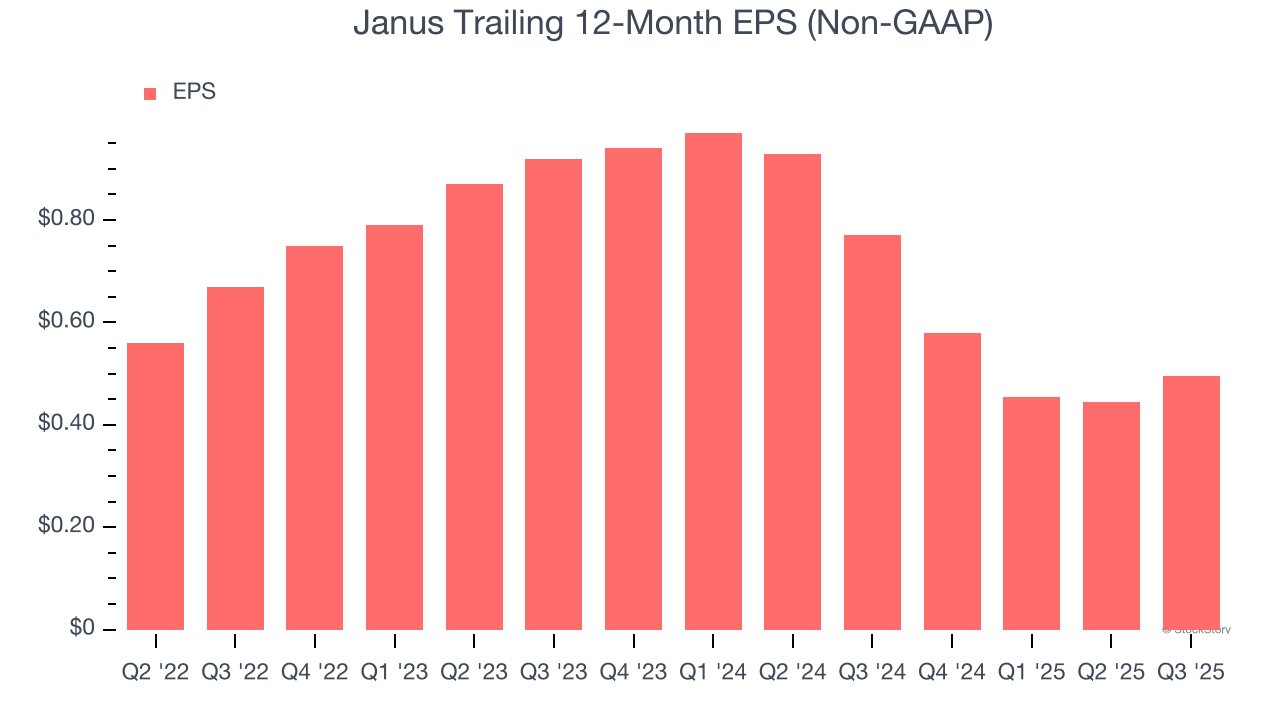
Sadly for Janus, its EPS declined by more than its revenue over the last two years, dropping 26.6%. This tells us the company struggled because its fixed cost base made it difficult to adjust to shrinking demand.
Diving into the nuances of Janus’s earnings can give us a better understanding of its performance. While we mentioned earlier that Janus’s operating margin expanded this quarter, a two-year view shows its margin has declined. This was the most relevant factor (aside from the revenue impact) behind its lower earnings; interest expenses and taxes can also affect EPS but don’t tell us as much about a company’s fundamentals.
In Q3, Janus reported adjusted EPS of $0.16, up from $0.11 in the same quarter last year. Despite growing year on year, this print missed analysts’ estimates. Over the next 12 months, Wall Street expects Janus’s full-year EPS of $0.50 to grow 58.2%.
Key Takeaways from Janus’s Q3 Results
We struggled to find many positives in these results. Its full-year EBITDA guidance missed and its revenue fell short of Wall Street’s estimates. Overall, this was a weaker quarter. The stock traded down 3.2% to $9 immediately following the results.
Janus’s latest earnings report disappointed. One quarter doesn’t define a company’s quality, so let’s explore whether the stock is a buy at the current price. If you’re making that decision, you should consider the bigger picture of valuation, business qualities, as well as the latest earnings. We cover that in our actionable full research report which you can read here, it’s free for active Edge members.