Software supply chain platform JFrog (NASDAQ: FROG) reported revenue ahead of Wall Streets expectations in Q3 CY2025, with sales up 25.5% year on year to $136.9 million. On top of that, next quarter’s revenue guidance ($137.5 million at the midpoint) was surprisingly good and 4.8% above what analysts were expecting. Its non-GAAP profit of $0.22 per share was 34.4% above analysts’ consensus estimates.
Is now the time to buy JFrog? Find out by accessing our full research report, it’s free for active Edge members.
JFrog (FROG) Q3 CY2025 Highlights:
- Revenue: $136.9 million vs analyst estimates of $128.4 million (25.5% year-on-year growth, 6.6% beat)
- Adjusted EPS: $0.22 vs analyst estimates of $0.16 (34.4% beat)
- Adjusted Operating Income: $25.61 million vs analyst estimates of $17.81 million (18.7% margin, 43.8% beat)
- Revenue Guidance for Q4 CY2025 is $137.5 million at the midpoint, above analyst estimates of $131.2 million
- Management raised its full-year Adjusted EPS guidance to $0.79 at the midpoint, a 14.5% increase
- Operating Margin: -15.8%, up from -27.4% in the same quarter last year
- Free Cash Flow Margin: 21%, down from 27.9% in the previous quarter
- Customers: 1,121 customers paying more than $100,000 annually
- Net Revenue Retention Rate: 118%, in line with the previous quarter
- Billings: $163.8 million at quarter end, up 24.1% year on year
- Market Capitalization: $5.38 billion
“JFrog has become the system of record for how modern software is built, secured, and deployed; the foundation of enterprise software supply chains in the era of AI,” said Shlomi Ben Haim, CEO and Co-founder of JFrog.
Company Overview
Named after the amphibian that continuously evolves from egg to tadpole to adult, JFrog (NASDAQ: FROG) provides a platform that helps organizations securely create, store, manage, and distribute software packages across any system.
Revenue Growth
A company’s long-term performance is an indicator of its overall quality. Any business can put up a good quarter or two, but the best consistently grow over the long haul. Over the last five years, JFrog grew its sales at an impressive 29.3% compounded annual growth rate. Its growth beat the average software company and shows its offerings resonate with customers, a helpful starting point for our analysis.
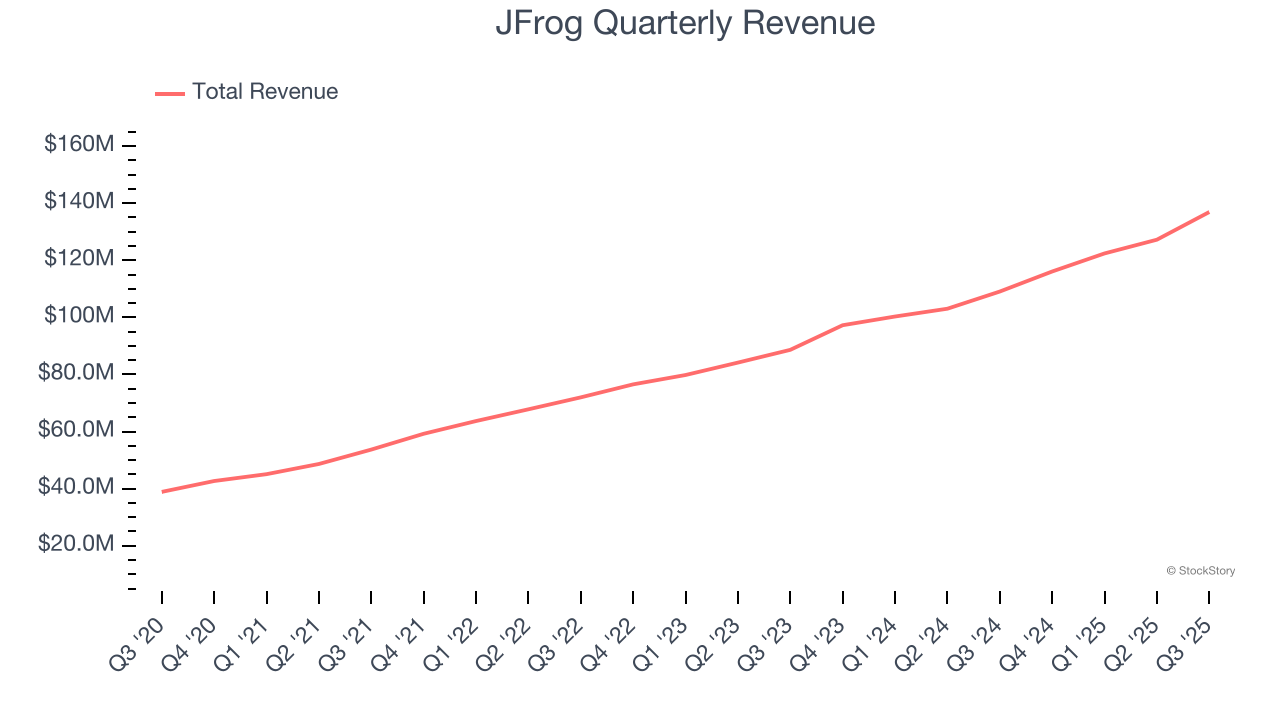
We at StockStory place the most emphasis on long-term growth, but within software, a half-decade historical view may miss recent innovations or disruptive industry trends. JFrog’s annualized revenue growth of 23.6% over the last two years is below its five-year trend, but we still think the results suggest healthy demand. 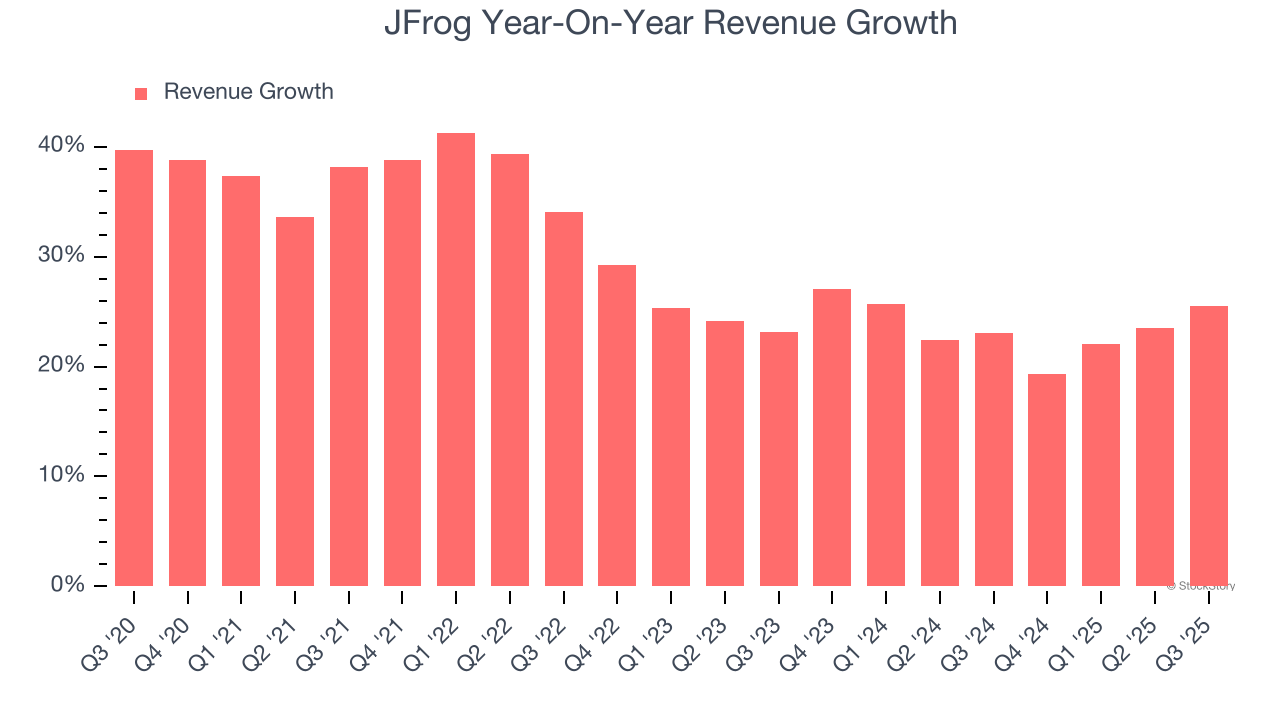
This quarter, JFrog reported robust year-on-year revenue growth of 25.5%, and its $136.9 million of revenue topped Wall Street estimates by 6.6%. Company management is currently guiding for a 18.5% year-on-year increase in sales next quarter.
Looking further ahead, sell-side analysts expect revenue to grow 12.6% over the next 12 months, a deceleration versus the last two years. This projection doesn't excite us and indicates its products and services will face some demand challenges. At least the company is tracking well in other measures of financial health.
Microsoft, Alphabet, Coca-Cola, Monster Beverage—all began as under-the-radar growth stories riding a massive trend. We’ve identified the next one: a profitable AI semiconductor play Wall Street is still overlooking. Go here for access to our full report.
Billings
Billings is a non-GAAP metric that is often called “cash revenue” because it shows how much money the company has collected from customers in a certain period. This is different from revenue, which must be recognized in pieces over the length of a contract.
JFrog’s billings punched in at $163.8 million in Q3, and over the last four quarters, its growth was impressive as it averaged 22.9% year-on-year increases. This performance aligned with its total sales growth, indicating robust customer demand. The high level of cash collected from customers also enhances liquidity and provides a solid foundation for future investments and growth. 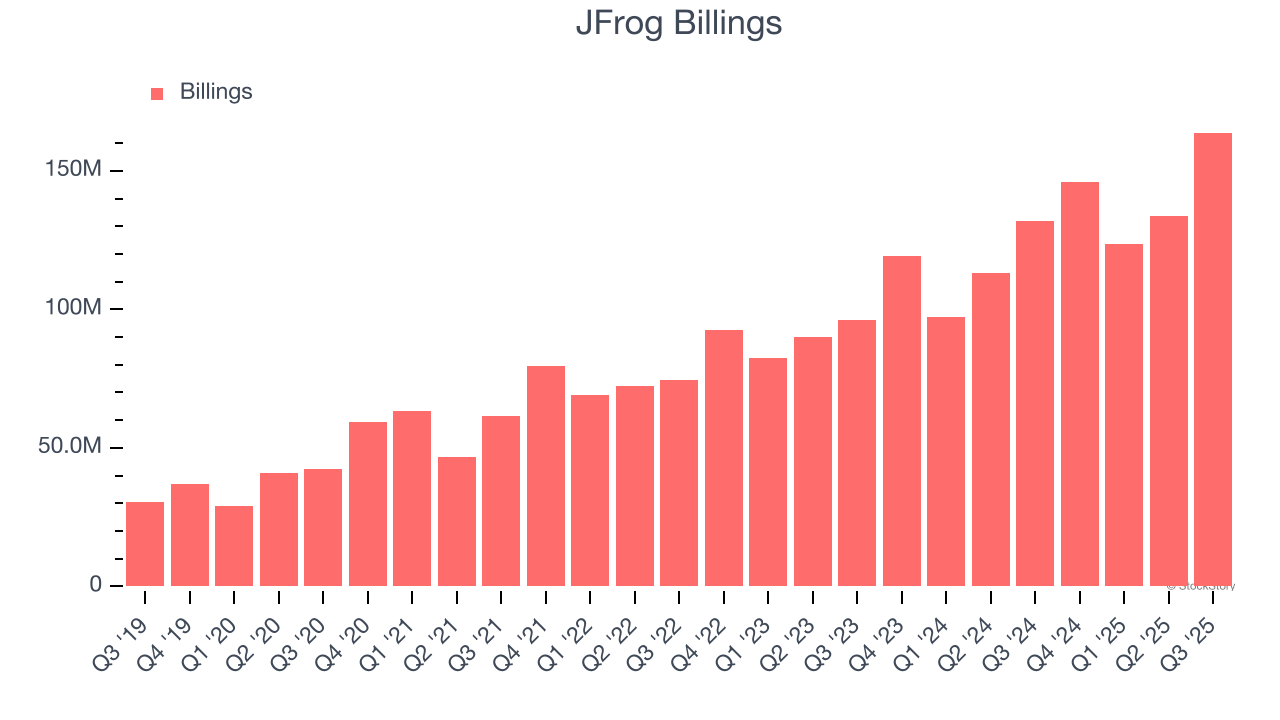
Customer Retention
One of the best parts about the software-as-a-service business model (and a reason why they trade at high valuation multiples) is that customers typically spend more on a company’s products and services over time.
JFrog’s net revenue retention rate, a key performance metric measuring how much money existing customers from a year ago are spending today, was 117% in Q3. This means JFrog would’ve grown its revenue by 17% even if it didn’t win any new customers over the last 12 months.
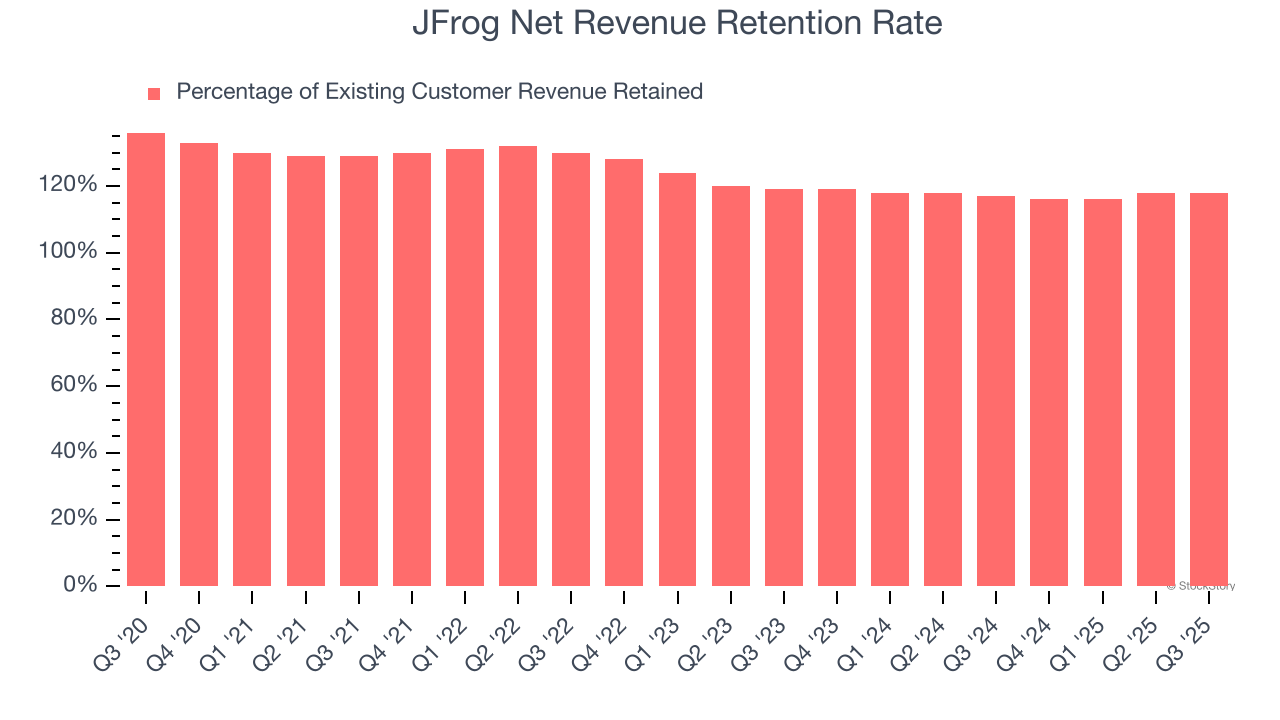
JFrog has a good net retention rate, proving that customers are satisfied with its software and getting more value from it over time, which is always great to see.
Key Takeaways from JFrog’s Q3 Results
It was great to see JFrog blow past analysts’ expectations across the board this quarter and raise its EPS guidance. We were also glad that its revenue and billings growth accelerated while its CAC payback period continued to fall, indicating better go-to-market efficiency. Zooming out, we think this quarter featured some important positives. The stock traded up 22.7% to $58 immediately after reporting.
Sure, JFrog had a solid quarter, but if we look at the bigger picture, is this stock a buy? What happened in the latest quarter matters, but not as much as longer-term business quality and valuation, when deciding whether to invest in this stock. We cover that in our actionable full research report which you can read here, it’s free for active Edge members.


