Network chips maker MACOM Technology Solutions (NASDAQ: MTSI) met Wall Streets revenue expectations in Q3 CY2025, with sales up 30.1% year on year to $261.2 million. The company expects next quarter’s revenue to be around $269 million, coming in 1.8% above analysts’ estimates. Its non-GAAP profit of $0.94 per share was 1.2% above analysts’ consensus estimates.
Is now the time to buy MACOM? Find out by accessing our full research report, it’s free for active Edge members.
MACOM (MTSI) Q3 CY2025 Highlights:
- Revenue: $261.2 million vs analyst estimates of $260.1 million (30.1% year-on-year growth, in line)
- Adjusted EPS: $0.94 vs analyst estimates of $0.93 (1.2% beat)
- Adjusted EBITDA: $75.71 million vs analyst estimates of $82.87 million (29% margin, 8.6% miss)
- Revenue Guidance for Q4 CY2025 is $269 million at the midpoint, above analyst estimates of $264.1 million
- Adjusted EPS guidance for Q4 CY2025 is $1 at the midpoint, above analyst estimates of $0.96
- Operating Margin: 15.2%, up from 13.7% in the same quarter last year
- Free Cash Flow Margin: 18.9%, down from 28.5% in the same quarter last year
- Inventory Days Outstanding: 182, up from 174 in the previous quarter
- Market Capitalization: $11.15 billion
“We built upon our strong foundation in fiscal year 2025, and we look forward to starting fiscal 2026,” said Stephen G. Daly, President and Chief Executive Officer, MACOM.
Company Overview
Founded in the 1950s as Microwave Associates, a communications supplier to the US Army Signal Corp, today MACOM Technology Solutions (NASDAQ: MTSI) is a provider of analog chips used in optical, wireless, and satellite networks.
Revenue Growth
A company’s long-term sales performance can indicate its overall quality. Any business can put up a good quarter or two, but the best consistently grow over the long haul. Luckily, MACOM’s sales grew at an impressive 12.8% compounded annual growth rate over the last five years. Its growth beat the average semiconductor company and shows its offerings resonate with customers, a helpful starting point for our analysis. Semiconductors are a cyclical industry, and long-term investors should be prepared for periods of high growth followed by periods of revenue contractions.
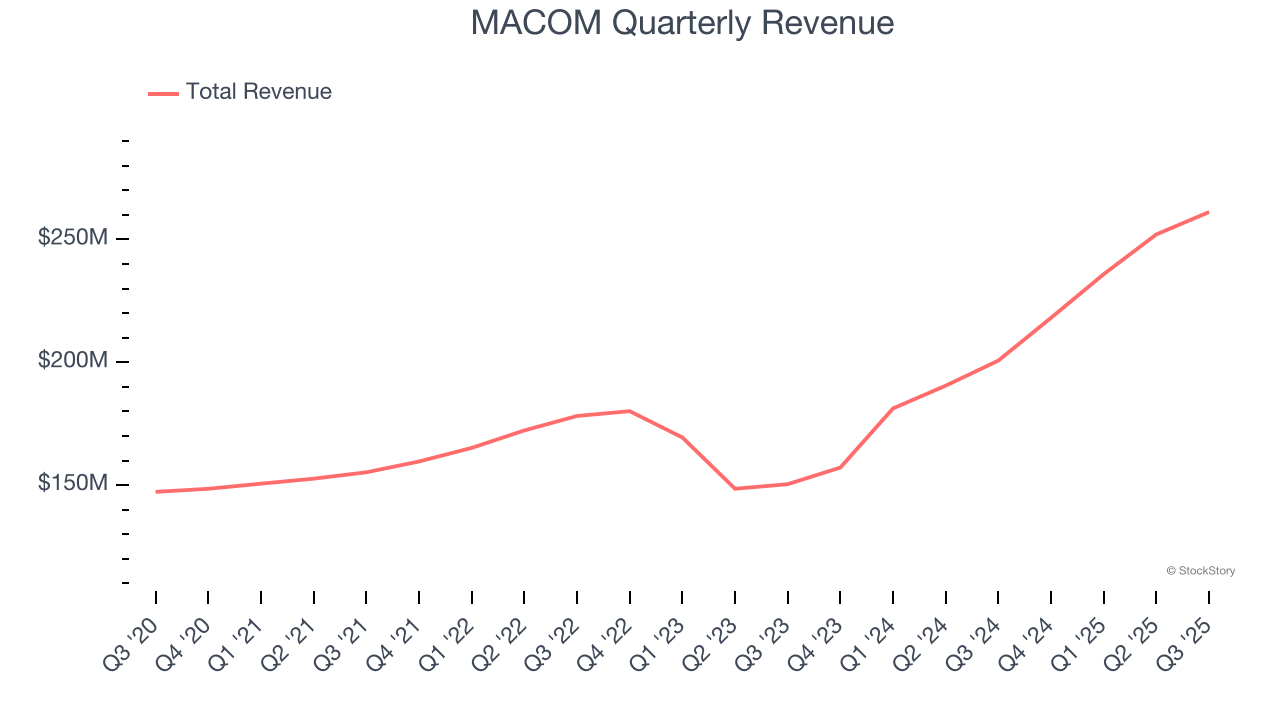
Long-term growth is the most important, but short-term results matter for semiconductors because the rapid pace of technological innovation (Moore's Law) could make yesterday's hit product obsolete today. MACOM’s annualized revenue growth of 22.1% over the last two years is above its five-year trend, suggesting its demand was strong and recently accelerated. 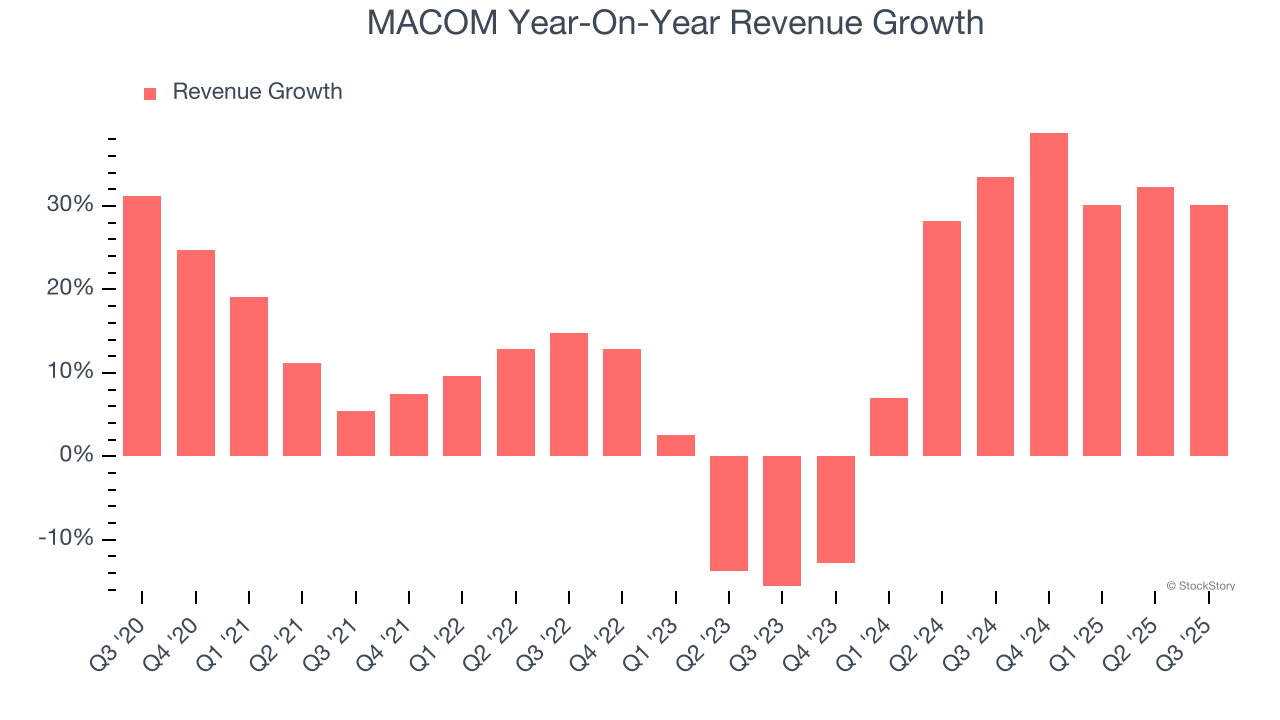
This quarter, MACOM’s year-on-year revenue growth of 30.1% was wonderful, and its $261.2 million of revenue was in line with Wall Street’s estimates. Beyond meeting estimates, this marks 7 straight quarters of growth, showing that the current upcycle has had a good run - a typical upcycle usually lasts 8-10 quarters. Company management is currently guiding for a 23.3% year-on-year increase in sales next quarter.
Looking further ahead, sell-side analysts expect revenue to grow 13.7% over the next 12 months, a deceleration versus the last two years. Still, this projection is commendable and implies the market is forecasting success for its products and services.
The 1999 book Gorilla Game predicted Microsoft and Apple would dominate tech before it happened. Its thesis? Identify the platform winners early. Today, enterprise software companies embedding generative AI are becoming the new gorillas. a profitable, fast-growing enterprise software stock that is already riding the automation wave and looking to catch the generative AI next.
Product Demand & Outstanding Inventory
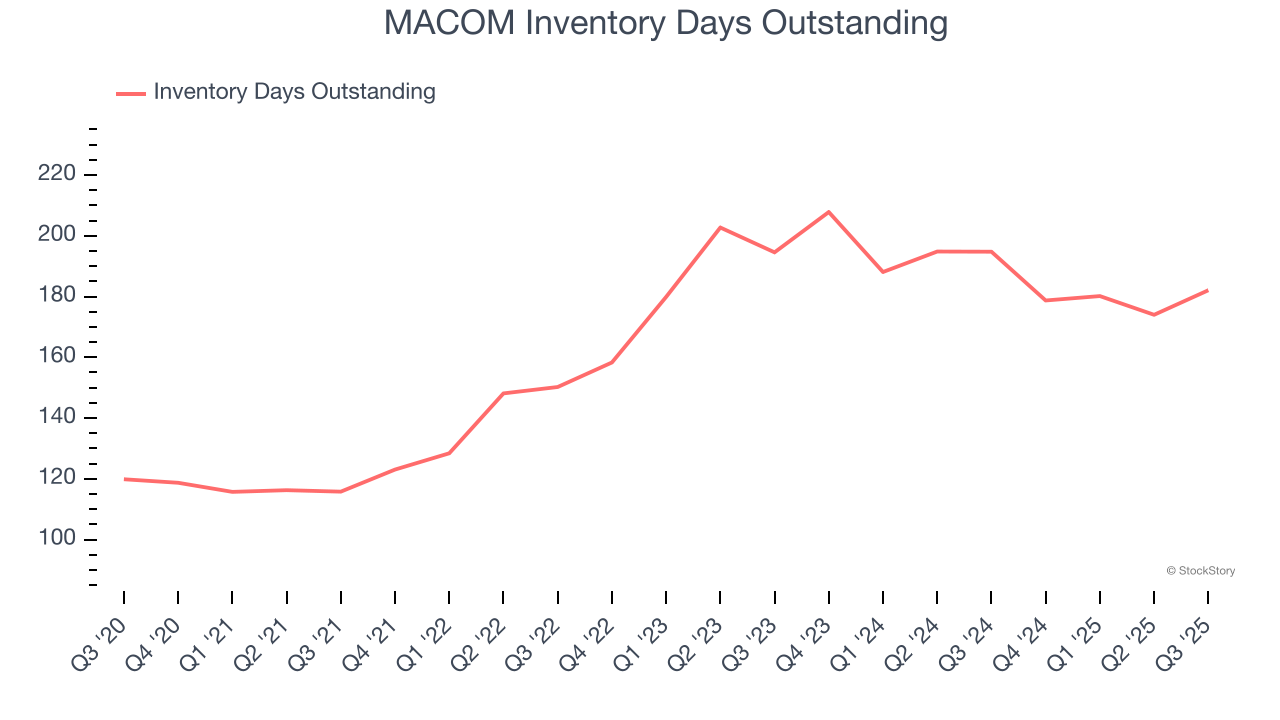
Days Inventory Outstanding (DIO) is an important metric for chipmakers, as it reflects a business’ capital intensity and the cyclical nature of semiconductor supply and demand. In a tight supply environment, inventories tend to be stable, allowing chipmakers to exert pricing power. Steadily increasing DIO can be a warning sign that demand is weak, and if inventories continue to rise, the company may have to downsize production.
This quarter, MACOM’s DIO came in at 182, which is 19 days above its five-year average, suggesting that the company’s inventory has grown to higher levels than we’ve seen in the past.
Key Takeaways from MACOM’s Q3 Results
It was encouraging to see MACOM’s revenue guidance for next quarter beat analysts’ expectations. We were also happy its adjusted operating income narrowly outperformed Wall Street’s estimates. On the other hand, its inventory levels increased. Zooming out, we think this was a mixed quarter. The stock traded up 2.9% to $154.01 immediately following the results.
Big picture, is MACOM a buy here and now? What happened in the latest quarter matters, but not as much as longer-term business quality and valuation, when deciding whether to invest in this stock. We cover that in our actionable full research report which you can read here, it’s free for active Edge members.