
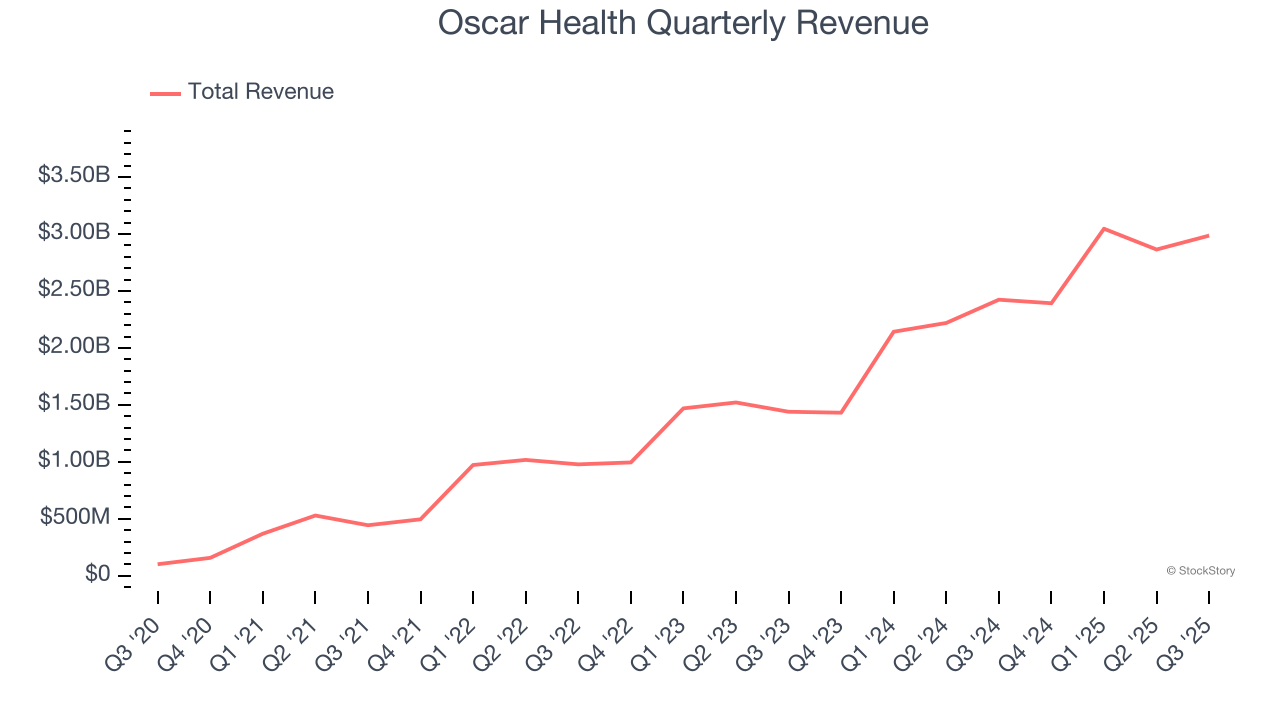
Health insurance company Oscar Health (NYSE: OSCR) fell short of the markets revenue expectations in Q3 CY2025, but sales rose 23.2% year on year to $2.99 billion. On the other hand, the company’s full-year revenue guidance of $12.1 billion at the midpoint came in 0.5% above analysts’ estimates. Its GAAP loss of $0.53 per share was 6.8% below analysts’ consensus estimates.
Is now the time to buy Oscar Health? Find out by accessing our full research report, it’s free for active Edge members.
Oscar Health (OSCR) Q3 CY2025 Highlights:
- Revenue: $2.99 billion vs analyst estimates of $3.09 billion (23.2% year-on-year growth, 3.3% miss)
- EPS (GAAP): -$0.53 vs analyst expectations of -$0.50 (6.8% miss)
- Adjusted EBITDA: -$101.5 million vs analyst estimates of -$119.5 million (-3.4% margin, 15.1% beat)
- Operating Margin: -4.3%, down from -2% in the same quarter last year
- Free Cash Flow was -$973.7 million compared to -$507.7 million in the same quarter last year
- Market Capitalization: $4.40 billion
“The individual market is the only source of affordable health coverage for 22 million people who power our economy,” said Mark Bertolini, CEO of Oscar Health.
Company Overview
Founded in 2012 to simplify the notoriously complex American healthcare system, Oscar Health (NYSE: OSCR) is a technology-focused health insurance company that offers individual and small group health plans through its cloud-native platform.
Revenue Growth
A company’s long-term sales performance can indicate its overall quality. Even a bad business can shine for one or two quarters, but a top-tier one grows for years. Luckily, Oscar Health’s sales grew at an incredible 96.4% compounded annual growth rate over the last five years. Its growth surpassed the average healthcare company and shows its offerings resonate with customers, a great starting point for our analysis.
We at StockStory place the most emphasis on long-term growth, but within healthcare, a half-decade historical view may miss recent innovations or disruptive industry trends. Oscar Health’s annualized revenue growth of 44.2% over the last two years is below its five-year trend, but we still think the results suggest healthy demand. 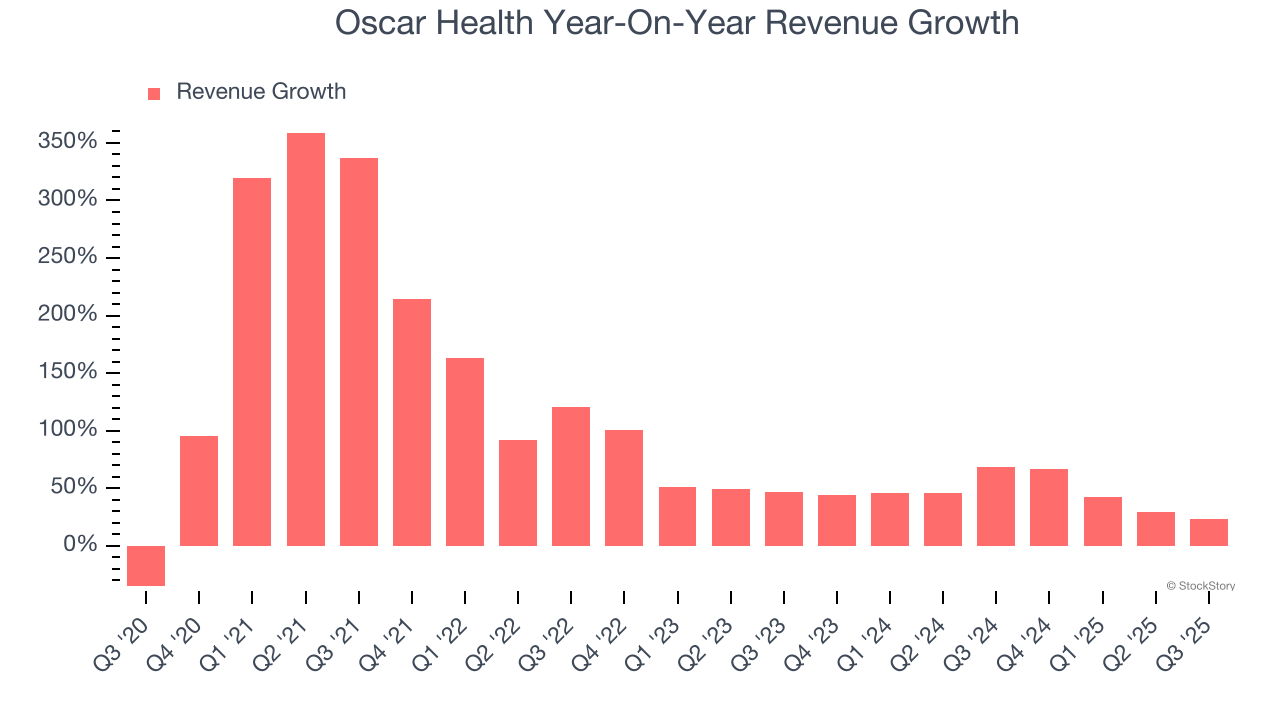
This quarter, Oscar Health generated an excellent 23.2% year-on-year revenue growth rate, but its $2.99 billion of revenue fell short of Wall Street’s high expectations.
Looking ahead, sell-side analysts expect revenue to grow 3.4% over the next 12 months, a deceleration versus the last two years. This projection is underwhelming and suggests its products and services will face some demand challenges. At least the company is tracking well in other measures of financial health.
While Wall Street chases Nvidia at all-time highs, an under-the-radar semiconductor supplier is dominating a critical AI component these giants can’t build without. Click here to access our free report one of our favorites growth stories.
Operating Margin
Operating margin is a key measure of profitability. Think of it as net income - the bottom line - excluding the impact of taxes and interest on debt, which are less connected to business fundamentals.
Oscar Health’s high expenses have contributed to an average operating margin of negative 5.2% over the last five years. Unprofitable healthcare companies require extra attention because they could get caught swimming naked when the tide goes out.
On the plus side, Oscar Health’s operating margin rose by 33.8 percentage points over the last five years, as its sales growth gave it operating leverage. Zooming in on its more recent performance, we can see the company’s trajectory is intact as its margin has also increased by 3.9 percentage points on a two-year basis. These data points are very encouraging and show momentum is on its side.
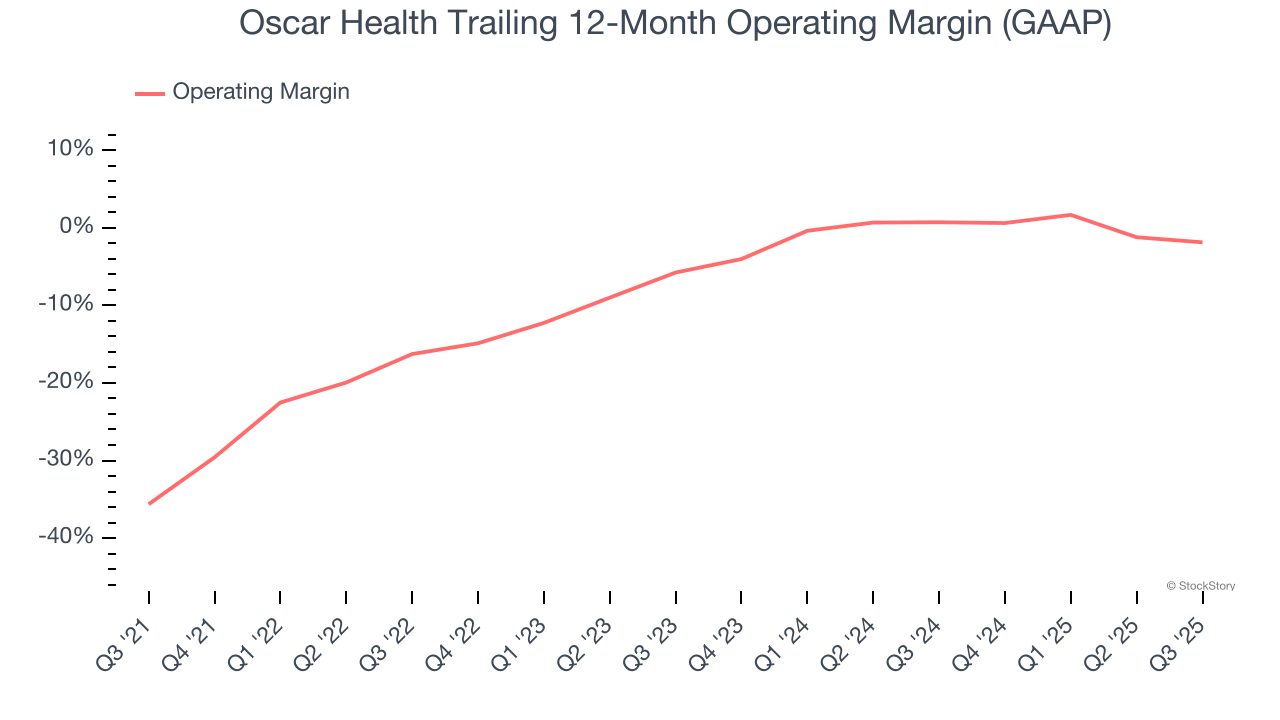
Oscar Health’s operating margin was negative 4.3% this quarter.
Earnings Per Share
Revenue trends explain a company’s historical growth, but the long-term change in earnings per share (EPS) points to the profitability of that growth – for example, a company could inflate its sales through excessive spending on advertising and promotions.
Although Oscar Health’s full-year earnings are still negative, it reduced its losses and improved its EPS by 34.4% annually over the last five years. The next few quarters will be critical for assessing its long-term profitability. We hope to see an inflection point soon.
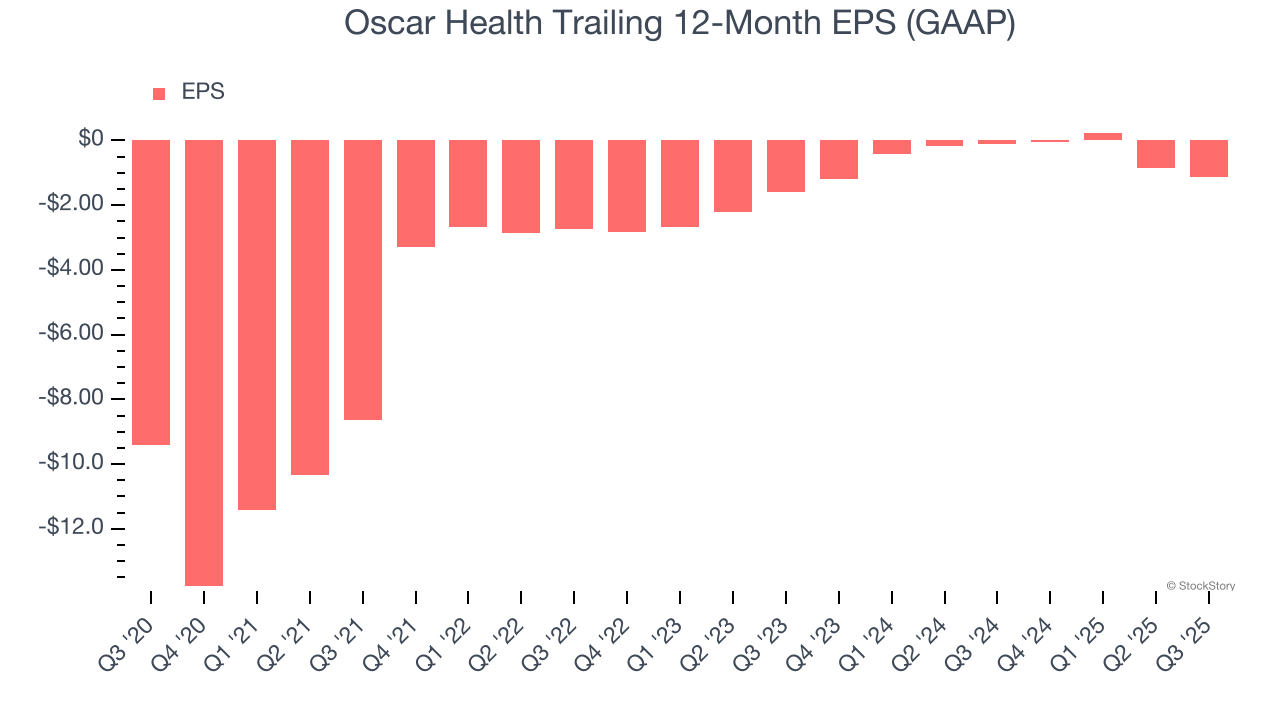
In Q3, Oscar Health reported EPS of negative $0.53, down from negative $0.22 in the same quarter last year. This print missed analysts’ estimates. Over the next 12 months, Wall Street expects Oscar Health to improve its earnings losses. Analysts forecast its full-year EPS of negative $1.14 will advance to negative $0.87.
Key Takeaways from Oscar Health’s Q3 Results
It was good to see Oscar Health provide full-year revenue guidance that slightly beat analysts’ expectations. On the other hand, its revenue missed and its EPS fell short of Wall Street’s estimates. Overall, this quarter was mixed. Still, the stock traded up 7.8% to $18.37 immediately after reporting.
Big picture, is Oscar Health a buy here and now? When making that decision, it’s important to consider its valuation, business qualities, as well as what has happened in the latest quarter. We cover that in our actionable full research report which you can read here, it’s free for active Edge members.