Fast-food pizza chain Papa John’s (NASDAQ: PZZA) fell short of the markets revenue expectations in Q3 CY2025, with sales flat year on year at $508.2 million. Its non-GAAP profit of $0.32 per share was 21.4% below analysts’ consensus estimates.
Is now the time to buy Papa John's? Find out by accessing our full research report, it’s free for active Edge members.
Papa John's (PZZA) Q3 CY2025 Highlights:
- Revenue: $508.2 million vs analyst estimates of $523.2 million (flat year on year, 2.9% miss)
- Adjusted EPS: $0.32 vs analyst expectations of $0.41 (21.4% miss)
- Adjusted EBITDA: $47.76 million vs analyst estimates of $51.46 million (9.4% margin, 7.2% miss)
- EBITDA guidance for the full year is $195 million at the midpoint, below analyst estimates of $211.7 million
- Operating Margin: 3.2%, down from 12.9% in the same quarter last year
- Free Cash Flow was $22.65 million, up from -$3.85 million in the same quarter last year
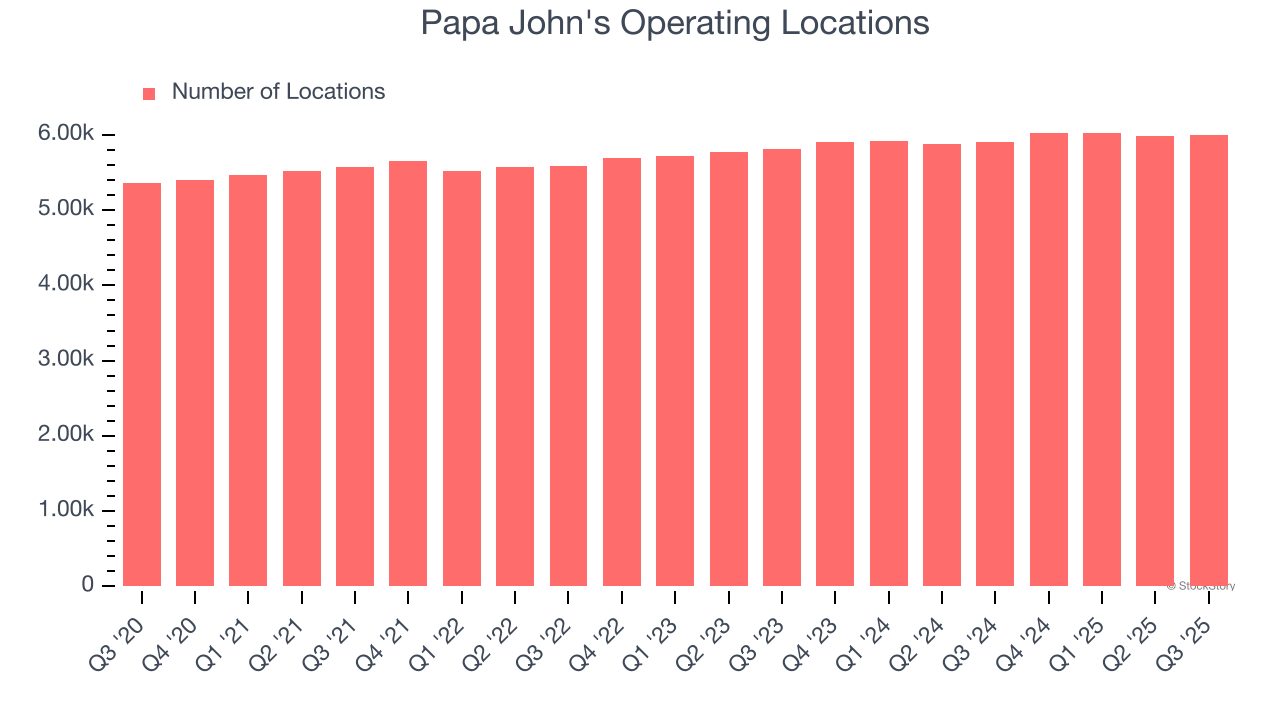
- Locations: 5,994 at quarter end, up from 5,908 in the same quarter last year
- Same-Store Sales were flat year on year (-4.9% in the same quarter last year)
- Market Capitalization: $1.35 billion
Company Overview
Founded by the eclectic John “Papa John” Schnatter, Papa John’s (NASDAQ: PZZA) is a globally recognized pizza delivery and carryout chain known for “better ingredients” and “better pizza”.
Revenue Growth
Reviewing a company’s long-term sales performance reveals insights into its quality. Any business can have short-term success, but a top-tier one grows for years.
With $2.09 billion in revenue over the past 12 months, Papa John's is a mid-sized restaurant chain, which sometimes brings disadvantages compared to larger competitors benefiting from better brand awareness and economies of scale.
As you can see below, Papa John’s sales grew at a sluggish 4.8% compounded annual growth rate over the last six years (we compare to 2019 to normalize for COVID-19 impacts).
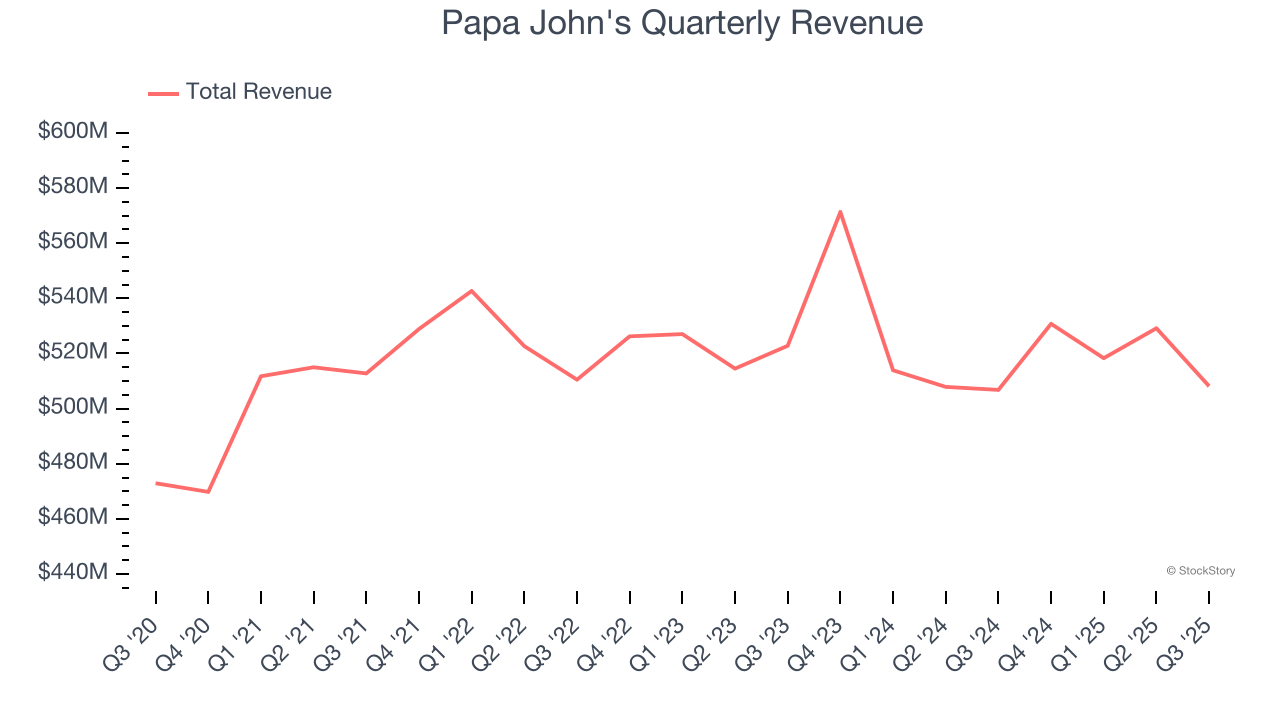
This quarter, Papa John’s $508.2 million of revenue was flat year on year, falling short of Wall Street’s estimates.
Looking ahead, sell-side analysts expect revenue to grow 1.6% over the next 12 months, a deceleration versus the last six years. This projection doesn't excite us and indicates its menu offerings will face some demand challenges.
Software is eating the world and there is virtually no industry left that has been untouched by it. That drives increasing demand for tools helping software developers do their jobs, whether it be monitoring critical cloud infrastructure, integrating audio and video functionality, or ensuring smooth content streaming. Click here to access a free report on our 3 favorite stocks to play this generational megatrend.
Restaurant Performance
Number of Restaurants
Papa John's sported 5,994 locations in the latest quarter. Over the last two years, it has opened new restaurants quickly, averaging 2.2% annual growth. This was faster than the broader restaurant sector. Furthermore, one dynamic making expansion more seamless is the company’s franchise model, where franchisees are primarily responsible for opening new restaurants while Papa John's provides support.
When a chain opens new restaurants, it usually means it’s investing for growth because there’s healthy demand for its meals and there are markets where its concepts have few or no locations.
Same-Store Sales
A company's restaurant base only paints one part of the picture. When demand is high, it makes sense to open more. But when demand is low, it’s prudent to close some locations and use the money in other ways. Same-store sales gives us insight into this topic because it measures organic growth at restaurants open for at least a year.
Papa John’s demand has been shrinking over the last two years as its same-store sales have averaged 1.5% annual declines. This performance is concerning - it shows Papa John's artificially boosts its revenue by building new restaurants. We’d like to see a company’s same-store sales rise before it takes on the costly, capital-intensive endeavor of expanding its restaurant base.
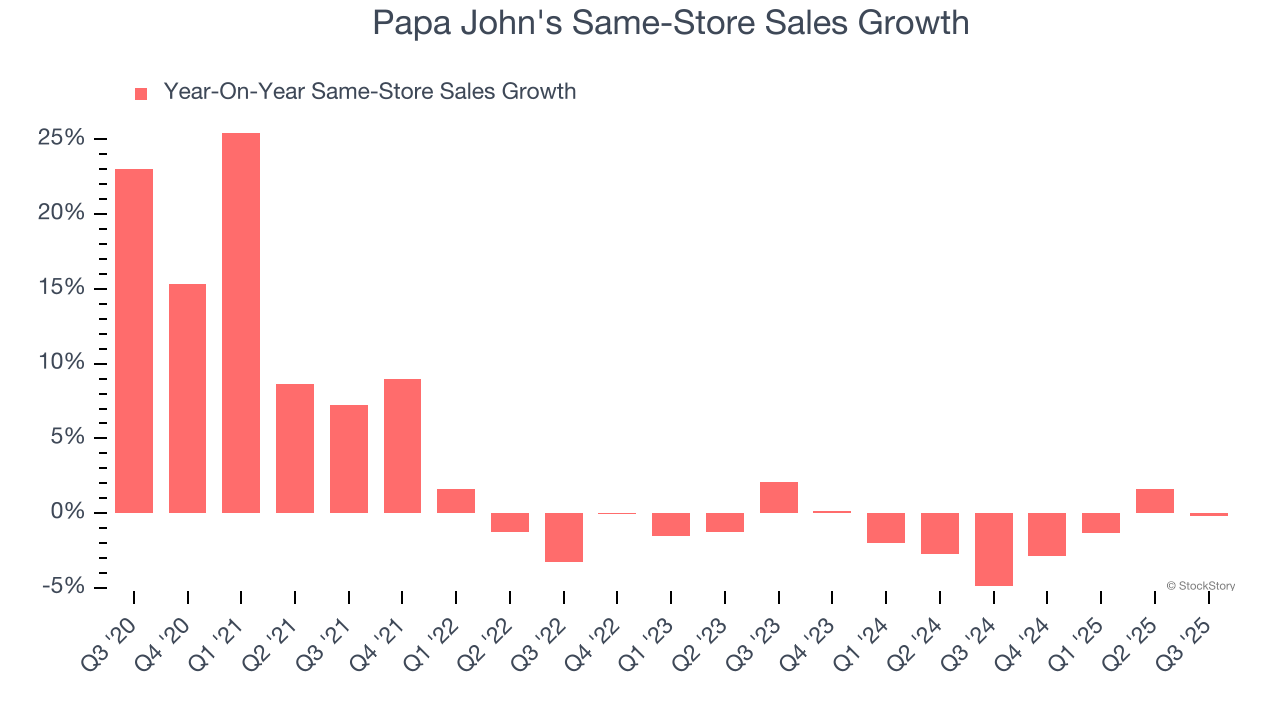
In the latest quarter, Papa John’s year on year same-store sales were flat. This performance was a well-appreciated turnaround from its historical levels, showing the business is improving.
Key Takeaways from Papa John’s Q3 Results
We struggled to find many positives in these results. Its full-year EBITDA guidance missed and its EBITDA fell short of Wall Street’s estimates. Overall, this was a weaker quarter. The stock traded down 6.2% to $38.70 immediately following the results.
The latest quarter from Papa John’s wasn’t that good. One earnings report doesn’t define a company’s quality, though, so let’s explore whether the stock is a buy at the current price. The latest quarter does matter, but not nearly as much as longer-term fundamentals and valuation, when deciding if the stock is a buy. We cover that in our actionable full research report which you can read here, it’s free for active Edge members.