
Technology distribution company ScanSource (NASDAQ: SCSC) missed Wall Street’s revenue expectations in Q3 CY2025, with sales falling 4.6% year on year to $739.7 million. On the other hand, the company’s full-year revenue guidance of $3.2 billion at the midpoint came in 0.6% above analysts’ estimates. Its non-GAAP profit of $1.06 per share was 14% above analysts’ consensus estimates.
Is now the time to buy ScanSource? Find out by accessing our full research report, it’s free for active Edge members.
ScanSource (SCSC) Q3 CY2025 Highlights:
- Revenue: $739.7 million vs analyst estimates of $787.4 million (4.6% year-on-year decline, 6.1% miss)
- Adjusted EPS: $1.06 vs analyst estimates of $0.93 (14% beat)
- Adjusted EBITDA: $38.59 million vs analyst estimates of $35.03 million (5.2% margin, 10.2% beat)
- The company reconfirmed its revenue guidance for the full year of $3.2 billion at the midpoint
- EBITDA guidance for the full year is $155 million at the midpoint, above analyst estimates of $150.8 million
- Operating Margin: 3.5%, in line with the same quarter last year
- Free Cash Flow Margin: 2.8%, down from 5.5% in the same quarter last year
- Market Capitalization: $924 million
“Our team delivered double-digit EPS growth and strong free cash flow in the first quarter,” said Mike Baur, Chair and CEO, ScanSource, Inc.
Company Overview
Operating as a crucial link in the technology supply chain since 1992, ScanSource (NASDAQ: SCSC) is a hybrid distributor that connects hardware, software, and cloud services from technology suppliers to resellers and business customers.
Revenue Growth
Examining a company’s long-term performance can provide clues about its quality. Any business can put up a good quarter or two, but many enduring ones grow for years.
With $3.00 billion in revenue over the past 12 months, ScanSource is a mid-sized business services company, which sometimes brings disadvantages compared to larger competitors benefiting from better economies of scale.
As you can see below, ScanSource struggled to increase demand as its $3.00 billion of sales for the trailing 12 months was close to its revenue five years ago. This shows demand was soft, a tough starting point for our analysis.
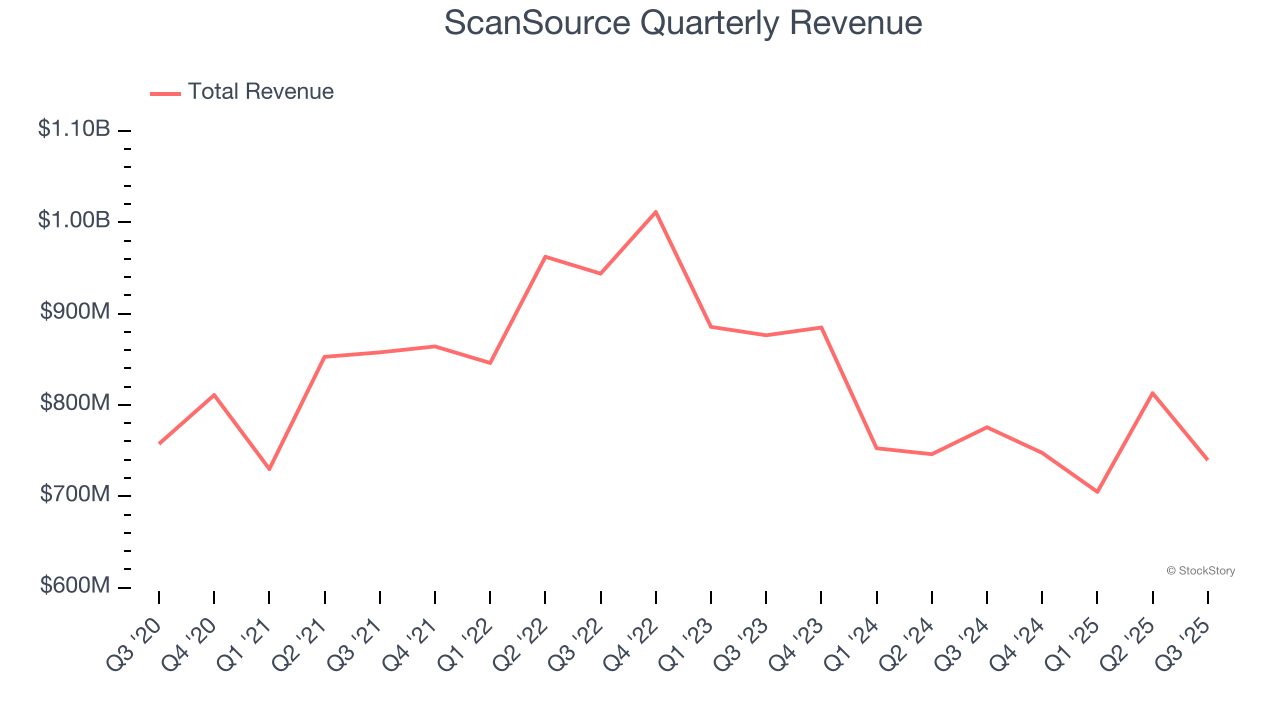
We at StockStory place the most emphasis on long-term growth, but within business services, a half-decade historical view may miss recent innovations or disruptive industry trends. ScanSource’s recent performance shows its demand remained suppressed as its revenue has declined by 11.1% annually over the last two years. 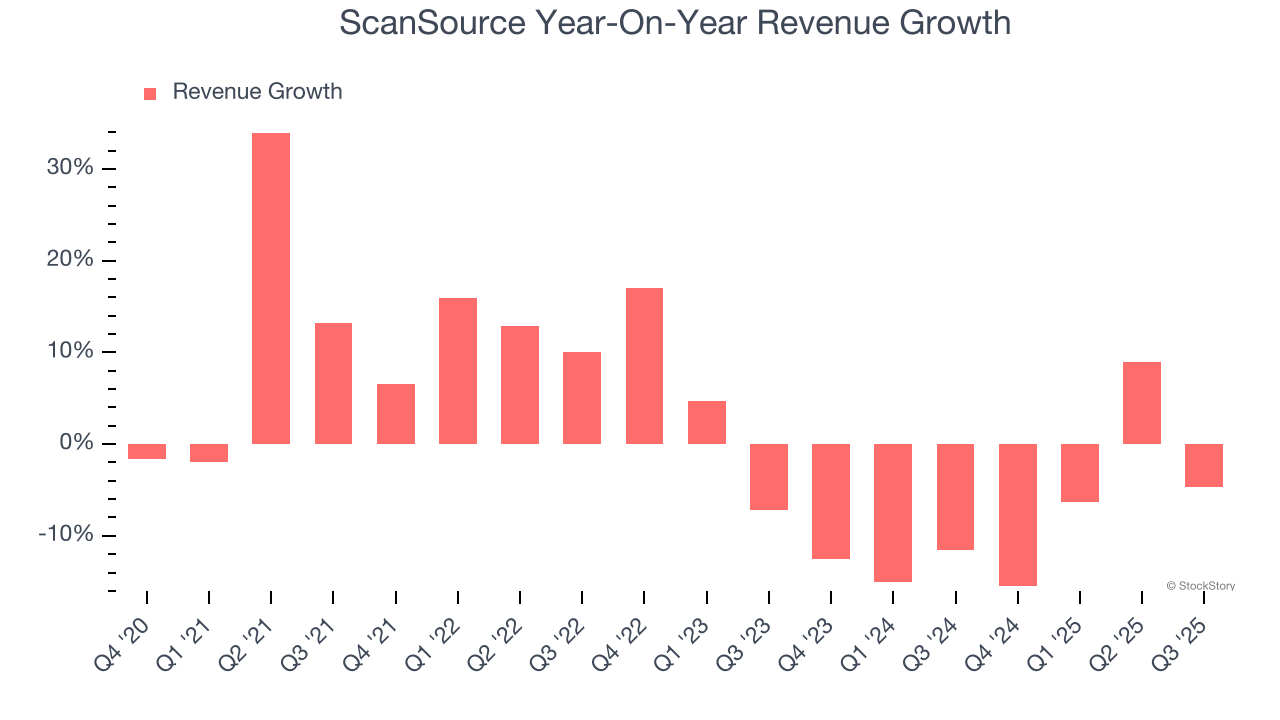
This quarter, ScanSource missed Wall Street’s estimates and reported a rather uninspiring 4.6% year-on-year revenue decline, generating $739.7 million of revenue.
Looking ahead, sell-side analysts expect revenue to grow 6.9% over the next 12 months, an improvement versus the last two years. This projection is above the sector average and implies its newer products and services will fuel better top-line performance.
The 1999 book Gorilla Game predicted Microsoft and Apple would dominate tech before it happened. Its thesis? Identify the platform winners early. Today, enterprise software companies embedding generative AI are becoming the new gorillas. a profitable, fast-growing enterprise software stock that is already riding the automation wave and looking to catch the generative AI next.
Operating Margin
Operating margin is one of the best measures of profitability because it tells us how much money a company takes home after subtracting all core expenses, like marketing and R&D.
ScanSource’s operating margin might fluctuated slightly over the last 12 months but has generally stayed the same, averaging 3.2% over the last five years. This profitability was lousy for a business services business and caused by its suboptimal cost structure.
Looking at the trend in its profitability, ScanSource’s operating margin might fluctuated slightly but has generally stayed the same over the last five years, which doesn’t help its cause.
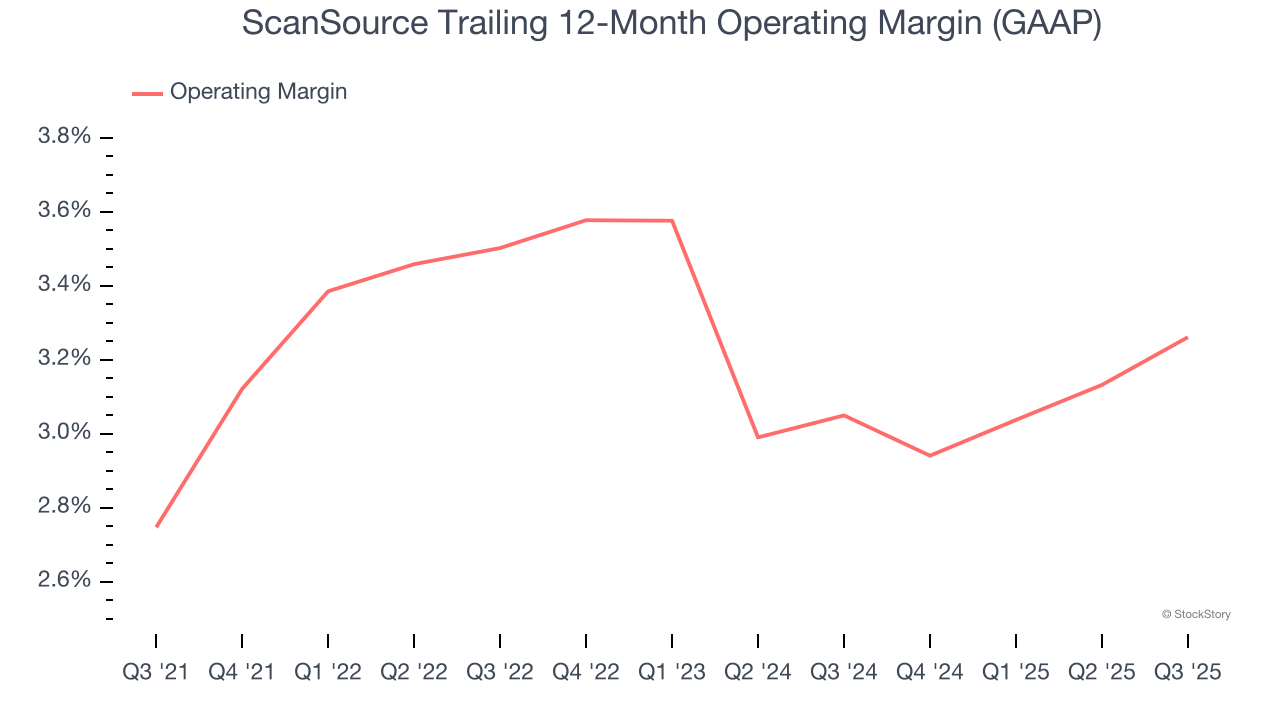
This quarter, ScanSource generated an operating margin profit margin of 3.5%, in line with the same quarter last year. This indicates the company’s overall cost structure has been relatively stable.
Earnings Per Share
Revenue trends explain a company’s historical growth, but the long-term change in earnings per share (EPS) points to the profitability of that growth – for example, a company could inflate its sales through excessive spending on advertising and promotions.
ScanSource’s EPS grew at an astounding 16.7% compounded annual growth rate over the last five years, higher than its flat revenue. This tells us management responded to softer demand by adapting its cost structure.
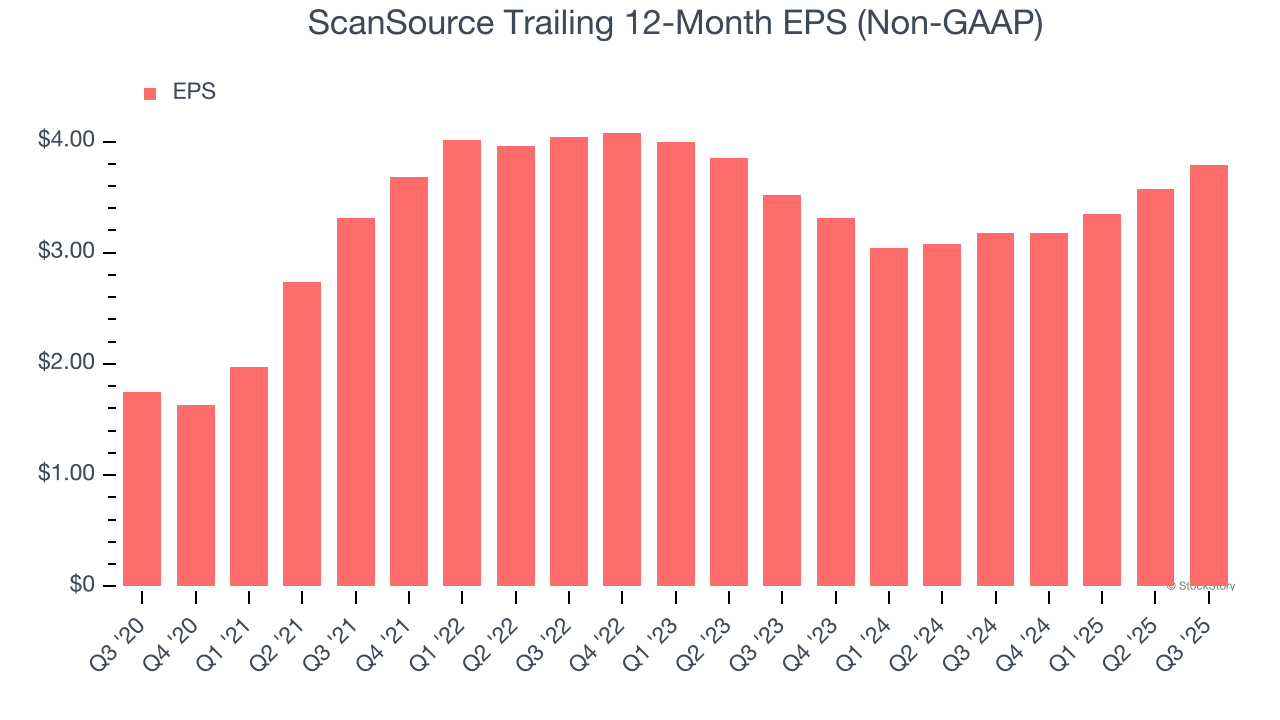
Like with revenue, we analyze EPS over a shorter period to see if we are missing a change in the business.
For ScanSource, its two-year annual EPS growth of 3.8% was lower than its five-year trend. We hope its growth can accelerate in the future.
In Q3, ScanSource reported adjusted EPS of $1.06, up from $0.84 in the same quarter last year. This print easily cleared analysts’ estimates, and shareholders should be content with the results. Over the next 12 months, Wall Street expects ScanSource’s full-year EPS of $3.79 to grow 10.7%.
Key Takeaways from ScanSource’s Q3 Results
It was good to see ScanSource beat analysts’ EPS expectations this quarter. We were also glad its full-year revenue guidance slightly exceeded Wall Street’s estimates. On the other hand, its revenue missed. Overall, this print had some key positives. Investors were likely hoping for more, and shares traded down 10.4% to $37.50 immediately after reporting.
So should you invest in ScanSource right now? If you’re making that decision, you should consider the bigger picture of valuation, business qualities, as well as the latest earnings. We cover that in our actionable full research report which you can read here, it’s free for active Edge members.