
Healthcare solutions provider Solventum (NYSE: SOLV) reported Q3 CY2025 results topping the market’s revenue expectations, but sales were flat year on year at $2.10 billion. Its non-GAAP profit of $1.50 per share was 4.7% above analysts’ consensus estimates.
Is now the time to buy Solventum? Find out by accessing our full research report, it’s free for active Edge members.
Solventum (SOLV) Q3 CY2025 Highlights:
- Revenue: $2.10 billion vs analyst estimates of $2.07 billion (flat year on year, 1.3% beat)
- Adjusted EPS: $1.50 vs analyst estimates of $1.43 (4.7% beat)
- Management raised its full-year Adjusted EPS guidance to $5.96 at the midpoint, a 7.3% increase
- Operating Margin: 80.6%, up from 13.2% in the same quarter last year
- Free Cash Flow was -$22 million, down from $76 million in the same quarter last year
- Organic Revenue rose 2.7% year on year vs analyst estimates of flat growth (178.6 basis point beat)
- Market Capitalization: $11.74 billion
"Our solid third quarter results and increased full-year 2025 guidance demonstrate we are delivering on our commitments and clearly progressing towards achieving our long-range plan," said Bryan Hanson, chief executive officer of Solventum.
Company Overview
Founded in 1985, Solventum (NYSE: SOLV) develops, manufactures, and commercializes a portfolio of healthcare products and services addressing critical customer and therapeutic patient needs.
Revenue Growth
A company’s top-line performance is one signal of its overall business quality. Strong growth can indicate it’s riding a successful new product or emerging trend. Solventum’s annualized revenue growth rate of 1.4% over the last two years was tepid for a healthcare business.

Solventum also reports organic revenue, which strips out one-time events like acquisitions and currency fluctuations that don’t accurately reflect its fundamentals. Over the last two years, Solventum’s organic revenue averaged 1.9% year-on-year growth. Because this number aligns with its two-year revenue growth, we can see the company’s core operations (not acquisitions and divestitures) drove most of its results. 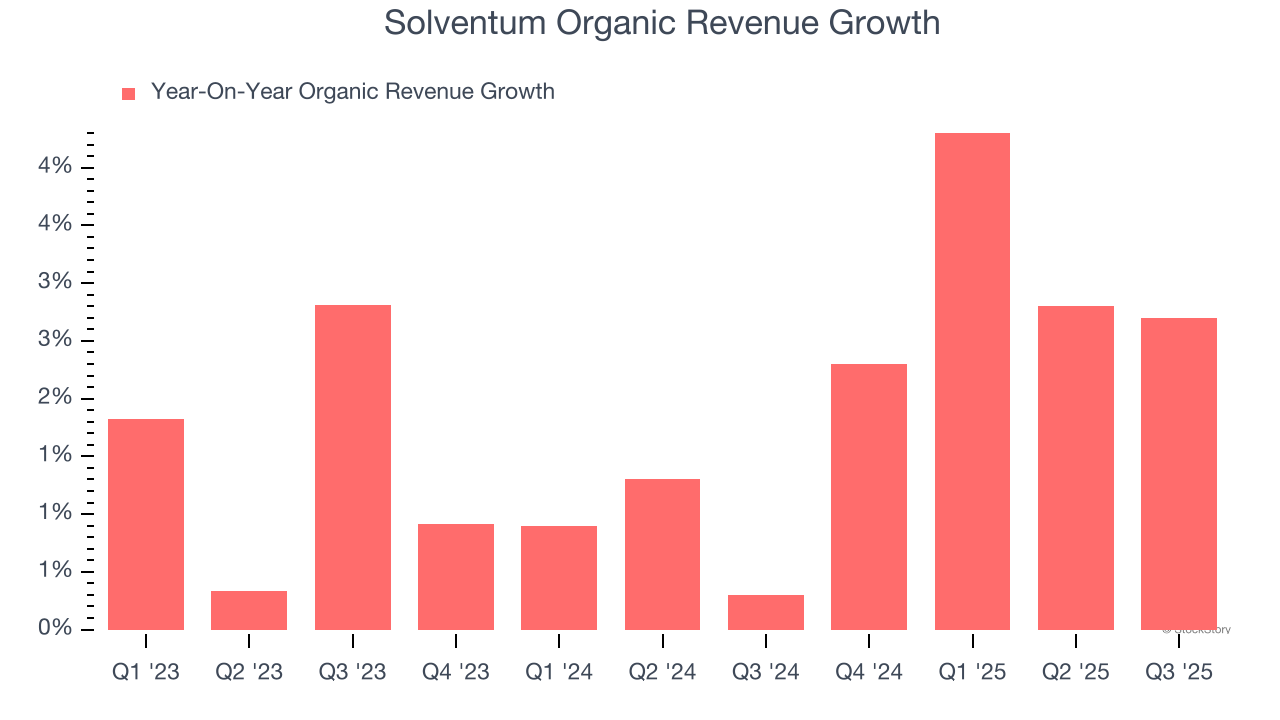
This quarter, Solventum’s $2.10 billion of revenue was flat year on year but beat Wall Street’s estimates by 1.3%.
Looking ahead, sell-side analysts expect revenue to decline by 5.7% over the next 12 months, a deceleration versus the last two years. This projection is underwhelming and suggests its products and services will see some demand headwinds.
The 1999 book Gorilla Game predicted Microsoft and Apple would dominate tech before it happened. Its thesis? Identify the platform winners early. Today, enterprise software companies embedding generative AI are becoming the new gorillas. a profitable, fast-growing enterprise software stock that is already riding the automation wave and looking to catch the generative AI next.
Operating Margin
Operating margin is one of the best measures of profitability because it tells us how much money a company takes home after subtracting all core expenses, like marketing and R&D.
Solventum has been an efficient company over the last four years. It was one of the more profitable businesses in the healthcare sector, boasting an average operating margin of 21%.
Analyzing the trend in its profitability, Solventum’s operating margin rose by 11.1 percentage points over the last four years. Zooming in on its more recent performance, we can see the company’s trajectory is intact as its margin has also increased by 5.6 percentage points on a two-year basis.
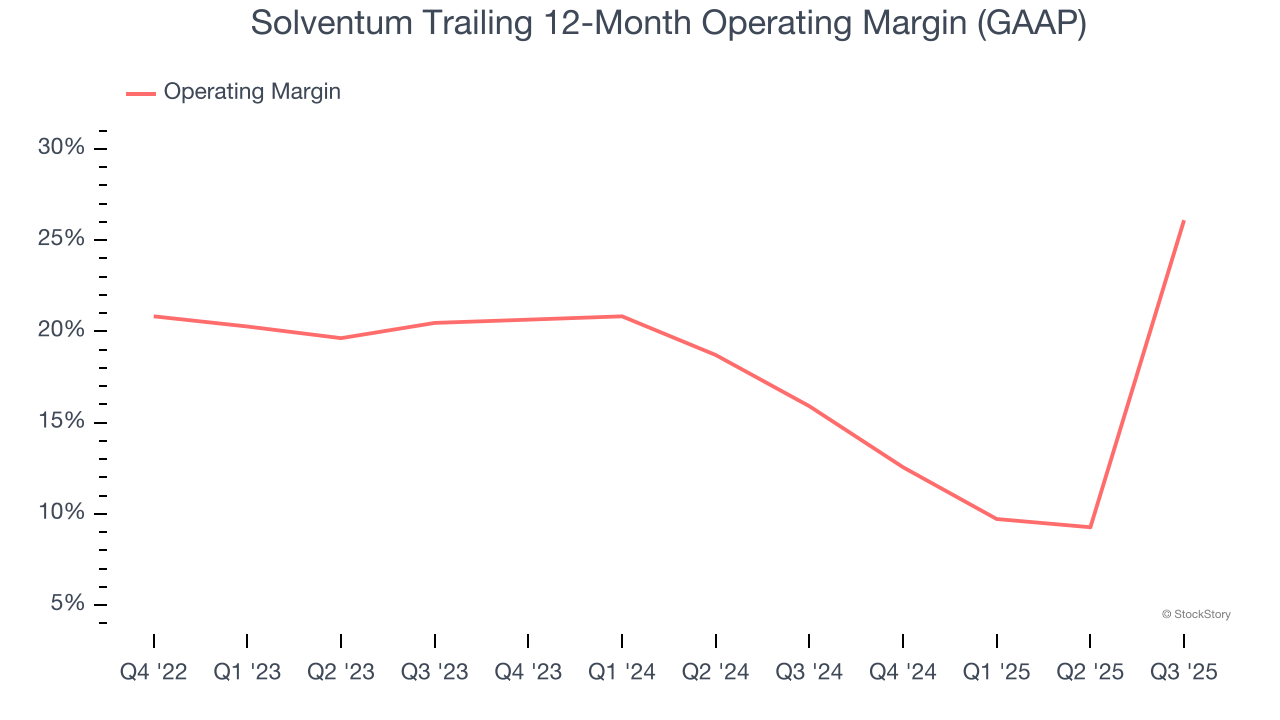
In Q3, Solventum generated an operating margin profit margin of 80.6%, up 67.4 percentage points year on year. This increase was a welcome development and shows it was more efficient.
Cash Is King
Free cash flow isn't a prominently featured metric in company financials and earnings releases, but we think it's telling because it accounts for all operating and capital expenses, making it tough to manipulate. Cash is king.
Solventum has shown robust cash profitability, giving it an edge over its competitors and the ability to reinvest or return capital to investors. The company’s free cash flow margin averaged 16.3% over the last four years, quite impressive for a healthcare business.
Taking a step back, we can see that Solventum’s margin dropped by 18.1 percentage points during that time. If its declines continue, it could signal increasing investment needs and capital intensity.
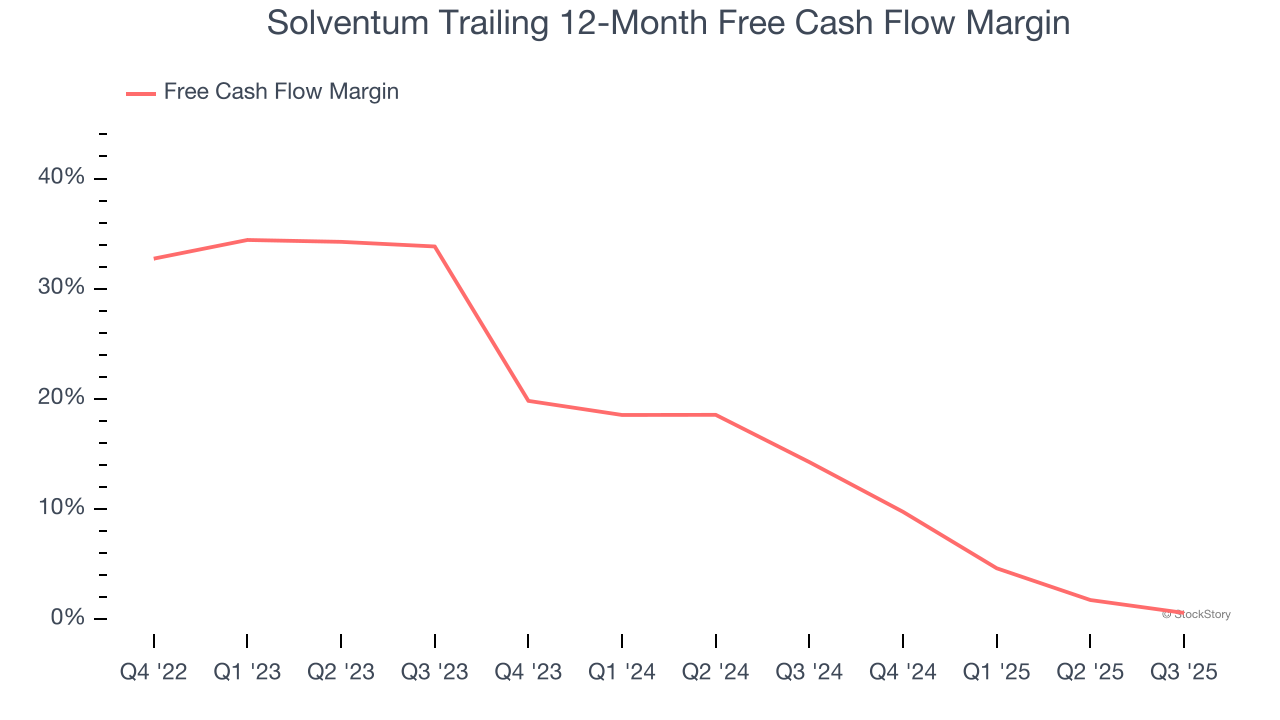
Solventum burned through $22 million of cash in Q3, equivalent to a negative 1% margin. The company’s cash flow turned negative after being positive in the same quarter last year, suggesting its historical struggles have dragged on.
Key Takeaways from Solventum’s Q3 Results
We enjoyed seeing Solventum beat analysts’ organic revenue expectations this quarter. We were also happy its revenue narrowly outperformed Wall Street’s estimates. Overall, this print had some key positives. The stock traded up 1.4% to $67.23 immediately after reporting.
Solventum put up rock-solid earnings, but one quarter doesn’t necessarily make the stock a buy. Let’s see if this is a good investment. What happened in the latest quarter matters, but not as much as longer-term business quality and valuation, when deciding whether to invest in this stock. We cover that in our actionable full research report which you can read here, it’s free for active Edge members.