Voice AI technology company SoundHound AI (NASDAQ: SOUN) reported Q3 CY2025 results beating Wall Street’s revenue expectations, with sales up 67.6% year on year to $42.05 million. Its GAAP loss of $0.27 per share was significantly below analysts’ consensus estimates.
Is now the time to buy SoundHound AI? Find out by accessing our full research report, it’s free for active Edge members.
SoundHound AI (SOUN) Q3 CY2025 Highlights:
- Revenue: $42.05 million vs analyst estimates of $40.93 million (67.6% year-on-year growth, 2.7% beat)
- EPS (GAAP): -$0.27 vs analyst estimates of -$0.10 (significant miss)
- Adjusted EBITDA: -$73.65 million vs analyst estimates of -$12.34 million (-175% margin, significant miss)
- Operating Margin: -276%, down from -135% in the same quarter last year
- Free Cash Flow was -$34.66 million compared to -$24.69 million in the previous quarter
- Market Capitalization: $6.41 billion
Company Overview
Born from the idea that machines should understand human speech as naturally as people do, SoundHound AI (NASDAQ: SOUN) develops voice recognition and conversational intelligence technology that enables businesses to integrate voice assistants into their products and services.
Revenue Growth
Reviewing a company’s long-term sales performance reveals insights into its quality. Even a bad business can shine for one or two quarters, but a top-tier one grows for years. Over the last four years, SoundHound AI grew its sales at an incredible 64.5% compounded annual growth rate. Its growth beat the average software company and shows its offerings resonate with customers, a helpful starting point for our analysis.
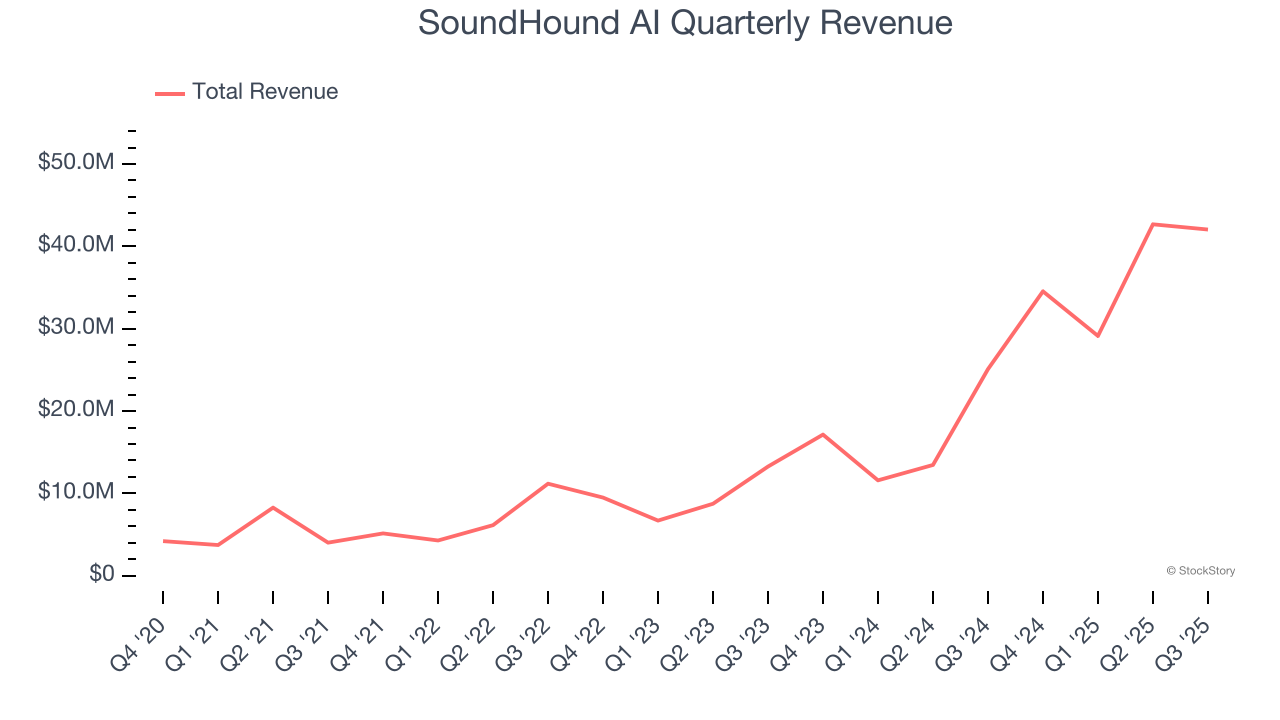
Long-term growth is the most important, but within software, a stretched historical view may miss new innovations or demand cycles. SoundHound AI’s annualized revenue growth of 97% over the last two years is above its four-year trend, suggesting its demand was strong and recently accelerated. 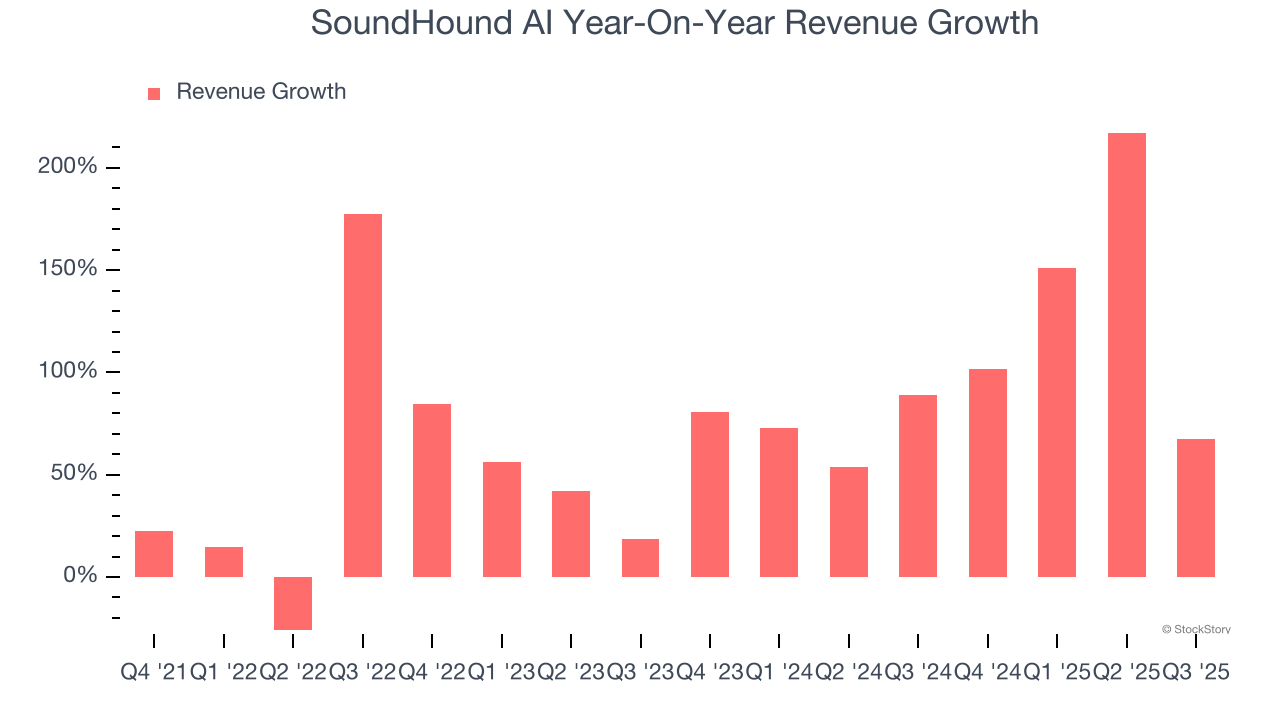
This quarter, SoundHound AI reported magnificent year-on-year revenue growth of 67.6%, and its $42.05 million of revenue beat Wall Street’s estimates by 2.7%.
Looking ahead, sell-side analysts expect revenue to grow 34.4% over the next 12 months, a deceleration versus the last two years. Still, this projection is commendable and suggests the market is forecasting success for its products and services.
Microsoft, Alphabet, Coca-Cola, Monster Beverage—all began as under-the-radar growth stories riding a massive trend. We’ve identified the next one: a profitable AI semiconductor play Wall Street is still overlooking. Go here for access to our full report.
Customer Acquisition Efficiency
The customer acquisition cost (CAC) payback period measures the months a company needs to recoup the money spent on acquiring a new customer. This metric helps assess how quickly a business can break even on its sales and marketing investments.
SoundHound AI’s recent customer acquisition efforts haven’t yielded returns as its CAC payback period was negative this quarter, meaning its incremental sales and marketing investments outpaced its revenue. The company’s inefficiency indicates it operates in a competitive market and must continue investing to grow.
Key Takeaways from SoundHound AI’s Q3 Results
It was encouraging to see SoundHound AI beat analysts’ revenue expectations this quarter. On the other hand, its EBITDA missed. Overall, this was a weaker quarter. The stock remained flat at $14.18 immediately after reporting.
SoundHound AI may have had a tough quarter, but does that actually create an opportunity to invest right now? If you’re making that decision, you should consider the bigger picture of valuation, business qualities, as well as the latest earnings. We cover that in our actionable full research report which you can read here, it’s free for active Edge members.