Stratasys has been treading water for the past six months, recording a small return of 1% while holding steady at $9.80. The stock also fell short of the S&P 500’s 21.3% gain during that period.
Is now the time to buy Stratasys, or should you be careful about including it in your portfolio? Check out our in-depth research report to see what our analysts have to say, it’s free for active Edge members.
Why Do We Think Stratasys Will Underperform?
We're cautious about Stratasys. Here are three reasons we avoid SSYS and a stock we'd rather own.
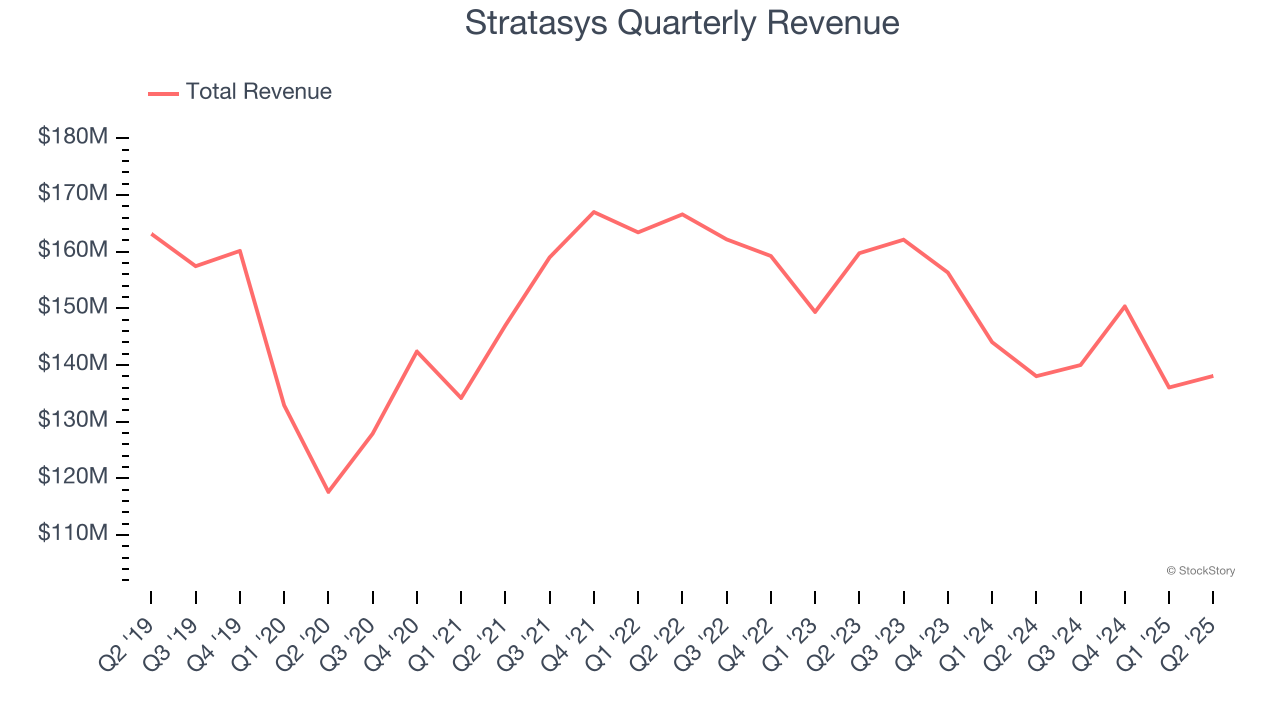
1. Long-Term Revenue Growth Flatter Than a Pancake
A company’s long-term sales performance can indicate its overall quality. Even a bad business can shine for one or two quarters, but a top-tier one grows for years. Unfortunately, Stratasys struggled to consistently increase demand as its $564.5 million of sales for the trailing 12 months was close to its revenue five years ago. This wasn’t a great result and is a sign of poor business quality.
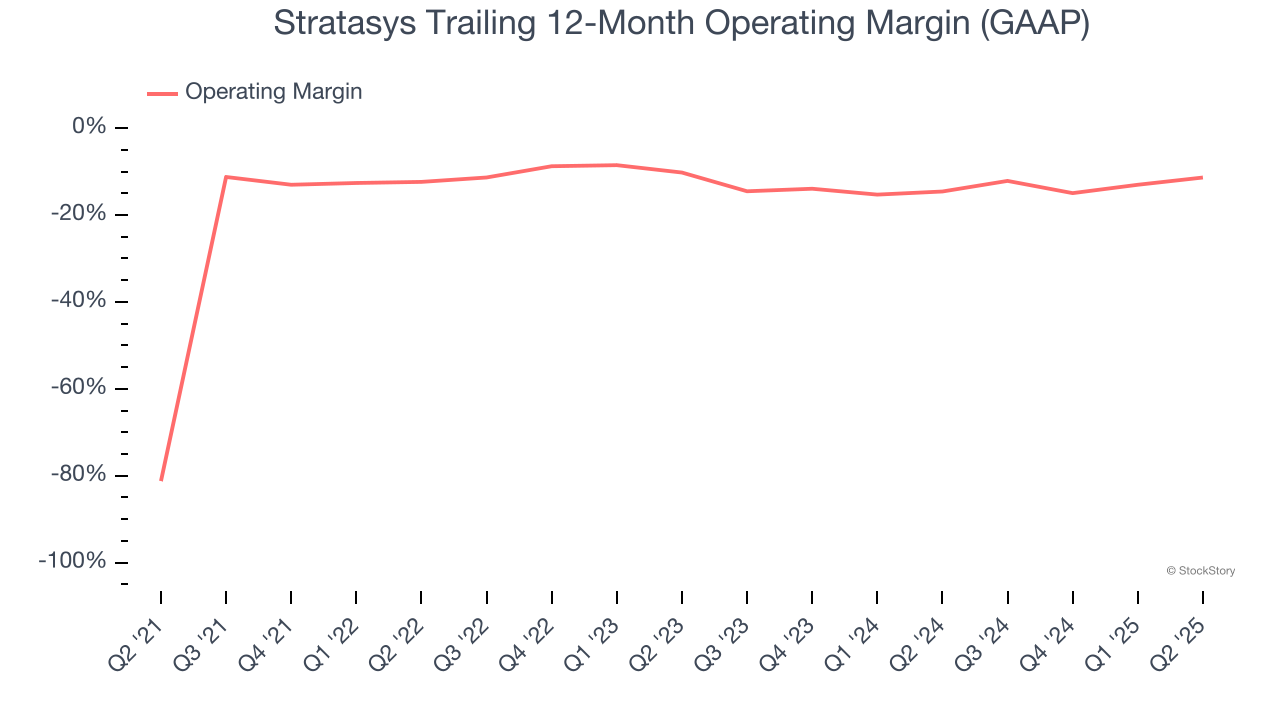
2. Operating Losses Sound the Alarms
Operating margin is a key measure of profitability. Think of it as net income - the bottom line - excluding the impact of taxes and interest on debt, which are less connected to business fundamentals.
Stratasys’s high expenses have contributed to an average operating margin of negative 24.8% over the last five years. Unprofitable industrials companies require extra attention because they could get caught swimming naked when the tide goes out. It’s hard to trust that the business can endure a full cycle.
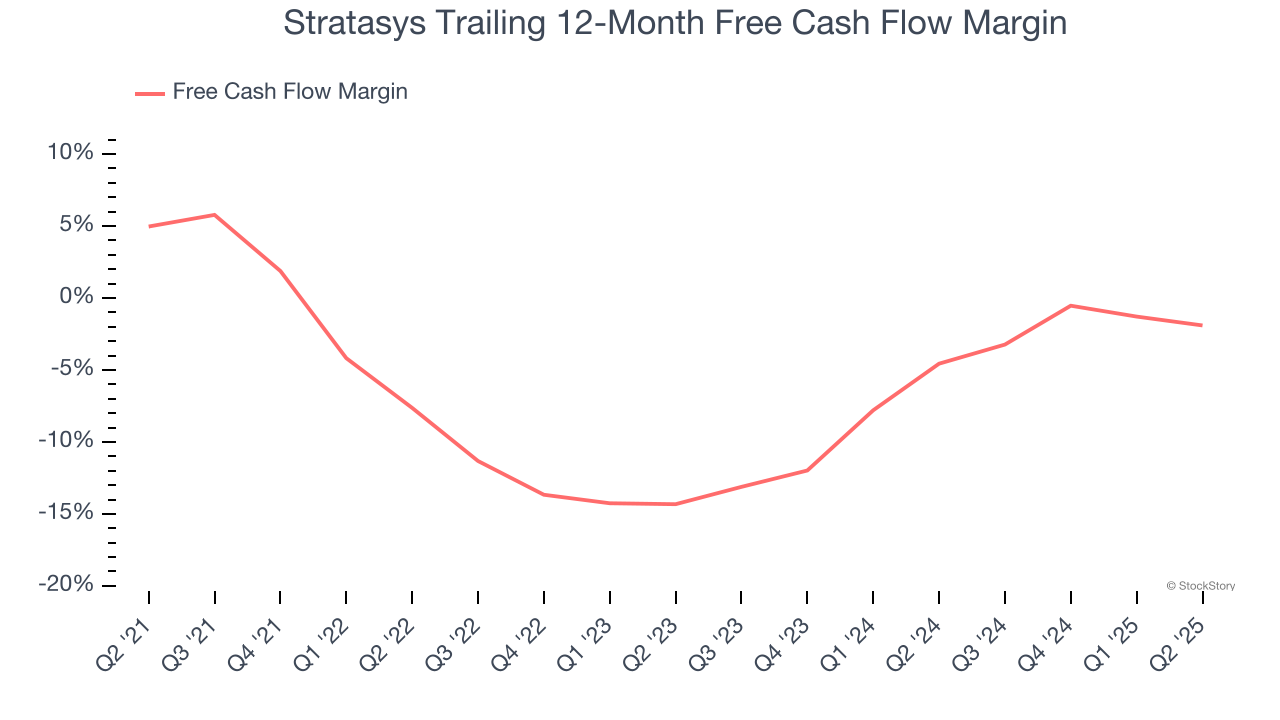
3. Free Cash Flow Margin Dropping
If you’ve followed StockStory for a while, you know we emphasize free cash flow. Why, you ask? We believe that in the end, cash is king, and you can’t use accounting profits to pay the bills.
As you can see below, Stratasys’s margin dropped by 6.9 percentage points over the last five years. It may have ticked higher more recently, but shareholders are likely hoping for its margin to at least revert to its historical level. Almost any movement in the wrong direction is undesirable because it’s already burning cash. If the longer-term trend returns, it could signal it’s becoming a more capital-intensive business. Stratasys’s free cash flow margin for the trailing 12 months was negative 1.9%.
Final Judgment
Stratasys falls short of our quality standards. With its shares underperforming the market lately, the stock trades at 68.7× forward P/E (or $9.80 per share). This multiple tells us a lot of good news is priced in - we think there are better stocks to buy right now. We’d suggest looking at the most entrenched endpoint security platform on the market.
Stocks We Like More Than Stratasys
Donald Trump’s April 2025 "Liberation Day" tariffs sent markets into a tailspin, but stocks have since rebounded strongly, proving that knee-jerk reactions often create the best buying opportunities.
The smart money is already positioning for the next leg up. Don’t miss out on the recovery - check out our Top 5 Strong Momentum Stocks for this week. This is a curated list of our High Quality stocks that have generated a market-beating return of 183% over the last five years (as of March 31st 2025).
Stocks that made our list in 2020 include now familiar names such as Nvidia (+1,545% between March 2020 and March 2025) as well as under-the-radar businesses like the once-micro-cap company Tecnoglass (+1,754% five-year return). Find your next big winner with StockStory today.
StockStory is growing and hiring equity analyst and marketing roles. Are you a 0 to 1 builder passionate about the markets and AI? See the open roles here.