
Diabetes technology company Tandem Diabetes Care (NASDAQ: TNDM) reported Q3 CY2025 results exceeding the market’s revenue expectations, with sales up 2.2% year on year to $249.3 million. Its GAAP loss of $0.31 per share was 3.6% above analysts’ consensus estimates.
Is now the time to buy Tandem Diabetes? Find out by accessing our full research report, it’s free for active Edge members.
Tandem Diabetes (TNDM) Q3 CY2025 Highlights:
- Revenue: $249.3 million vs analyst estimates of $236 million (2.2% year-on-year growth, 5.6% beat)
- EPS (GAAP): -$0.31 vs analyst estimates of -$0.32 (3.6% beat)
- Operating Margin: -9.2%, up from -10.7% in the same quarter last year
- Sales Volumes fell 4.8% year on year (24.7% in the same quarter last year)
- Market Capitalization: $991.2 million
Company Overview
With technology that automatically adjusts insulin delivery based on continuous glucose monitoring data, Tandem Diabetes Care (NASDAQ: TNDM) develops and manufactures automated insulin delivery systems that help people with diabetes manage their blood glucose levels.
Revenue Growth
Examining a company’s long-term performance can provide clues about its quality. Any business can experience short-term success, but top-performing ones enjoy sustained growth for years. Thankfully, Tandem Diabetes’s 18.1% annualized revenue growth over the last five years was impressive. Its growth beat the average healthcare company and shows its offerings resonate with customers.
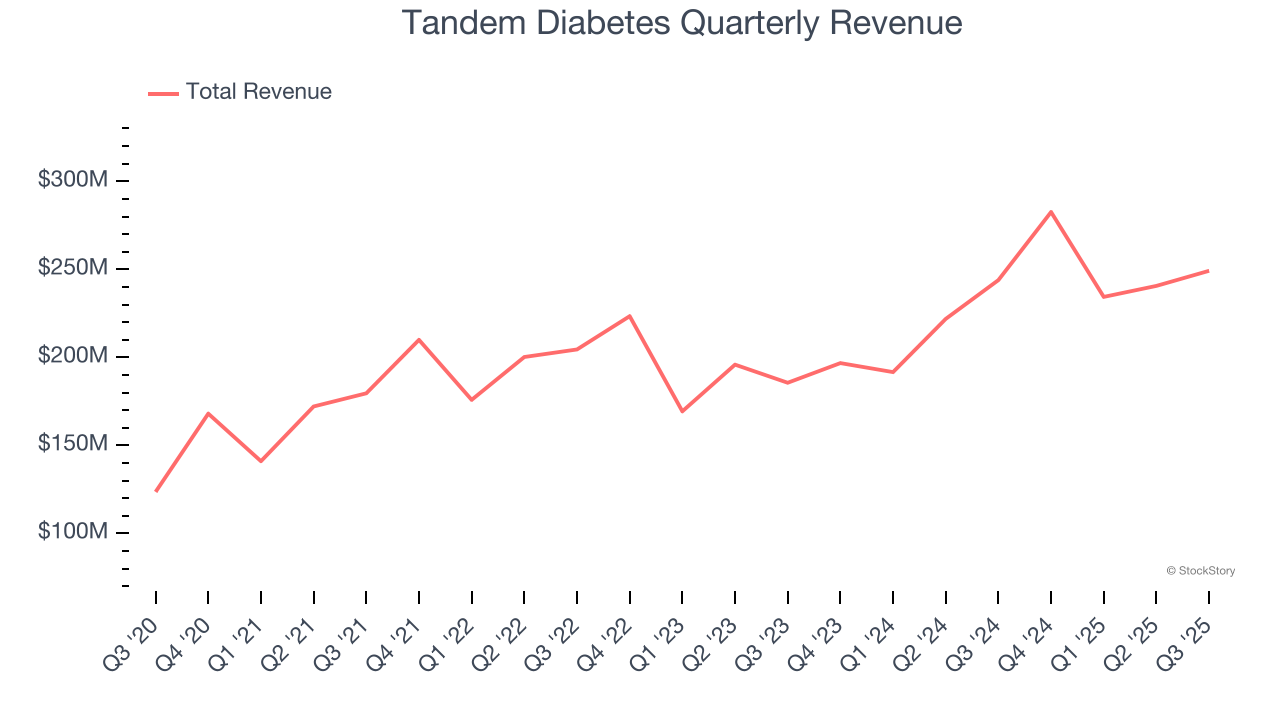
Long-term growth is the most important, but within healthcare, a half-decade historical view may miss new innovations or demand cycles. Tandem Diabetes’s annualized revenue growth of 14% over the last two years is below its five-year trend, but we still think the results suggest healthy demand. 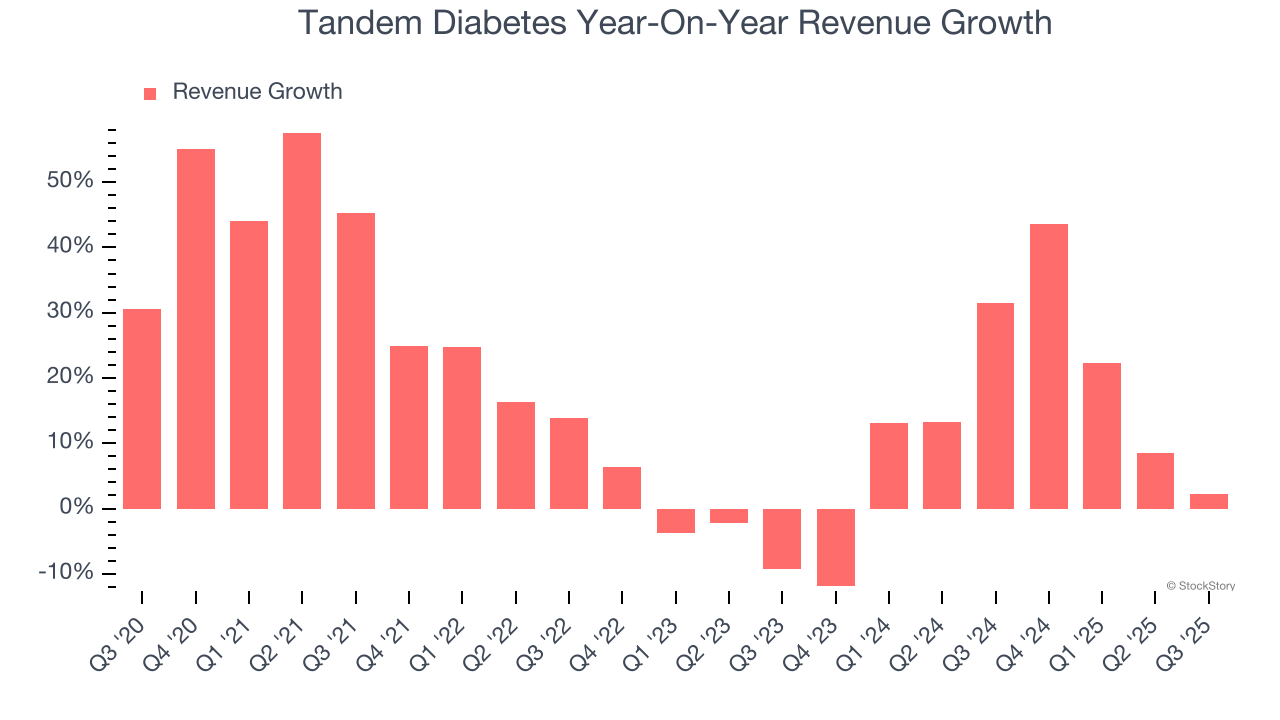
We can better understand the company’s revenue dynamics by analyzing its number of pump shipments, which reached 20,000 in the latest quarter. Over the last two years, Tandem Diabetes’s pump shipments averaged 4.4% year-on-year growth. Because this number is lower than its revenue growth, we can see the company benefited from price increases. 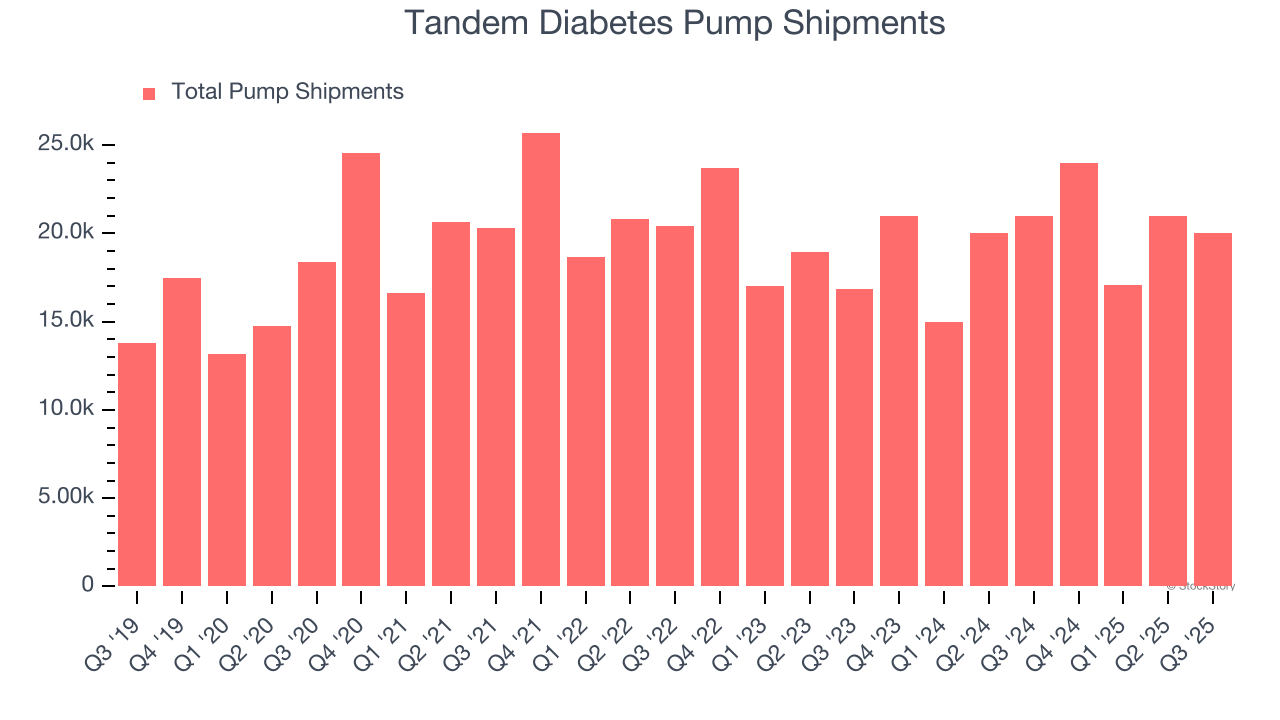
This quarter, Tandem Diabetes reported modest year-on-year revenue growth of 2.2% but beat Wall Street’s estimates by 5.6%.
Looking ahead, sell-side analysts expect revenue to grow 6.5% over the next 12 months, a deceleration versus the last two years. Despite the slowdown, this projection is above average for the sector and indicates the market sees some success for its newer products and services.
While Wall Street chases Nvidia at all-time highs, an under-the-radar semiconductor supplier is dominating a critical AI component these giants can’t build without. Click here to access our free report one of our favorites growth stories.
Adjusted Operating Margin
Adjusted operating margin is a key measure of profitability. Think of it as net income (the bottom line) excluding the impact of non-recurring expenses, taxes, and interest on debt - metrics less connected to business fundamentals.
Tandem Diabetes’s high expenses have contributed to an average adjusted operating margin of negative 10% over the last five years. Unprofitable healthcare companies require extra attention because they could get caught swimming naked when the tide goes out. It’s hard to trust that the business can endure a full cycle.
Looking at the trend in its profitability, Tandem Diabetes’s adjusted operating margin decreased by 23.6 percentage points over the last five years. The company’s two-year trajectory also shows it failed to get its profitability back to the peak as its margin fell by 7.4 percentage points. This performance was poor no matter how you look at it - it shows its expenses were rising and it couldn’t pass those costs onto its customers.
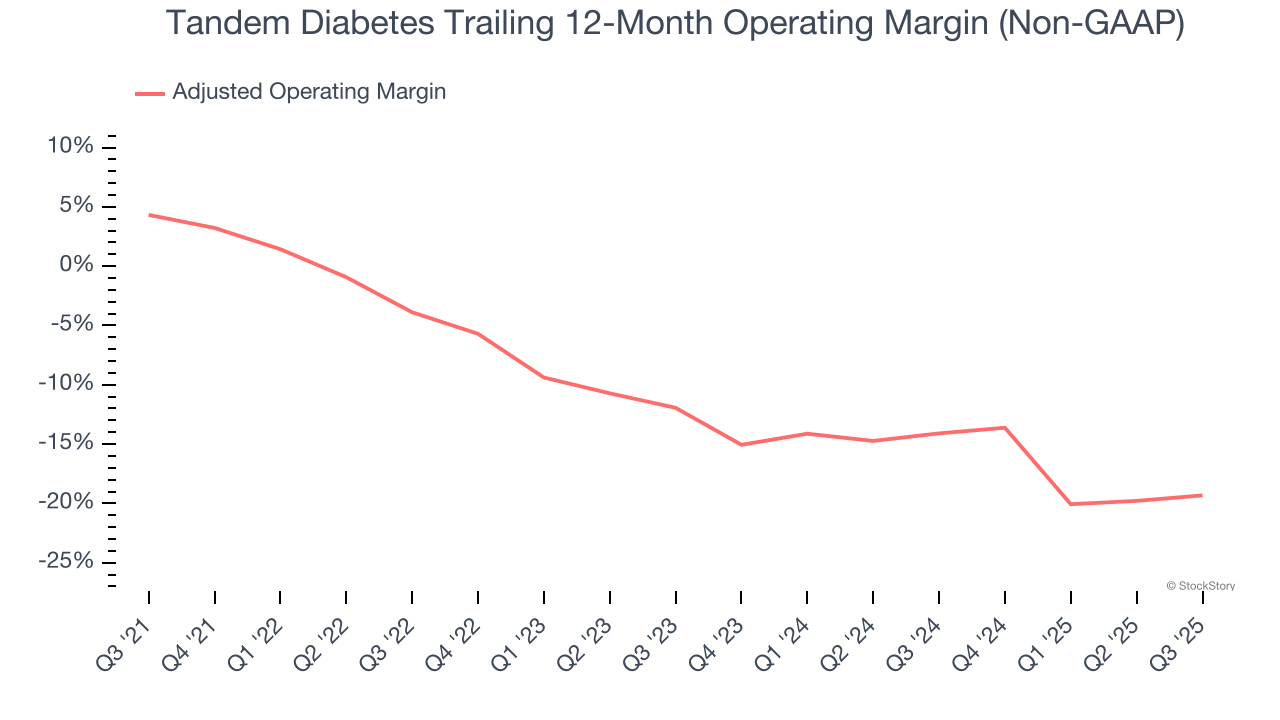
In Q3, Tandem Diabetes generated a negative 9.2% adjusted operating margin.
Earnings Per Share
Revenue trends explain a company’s historical growth, but the long-term change in earnings per share (EPS) points to the profitability of that growth – for example, a company could inflate its sales through excessive spending on advertising and promotions.
Tandem Diabetes’s earnings losses deepened over the last five years as its EPS dropped 30.4% annually. We tend to steer our readers away from companies with falling EPS, where diminishing earnings could imply changing secular trends and preferences. If the tide turns unexpectedly, Tandem Diabetes’s low margin of safety could leave its stock price susceptible to large downswings.
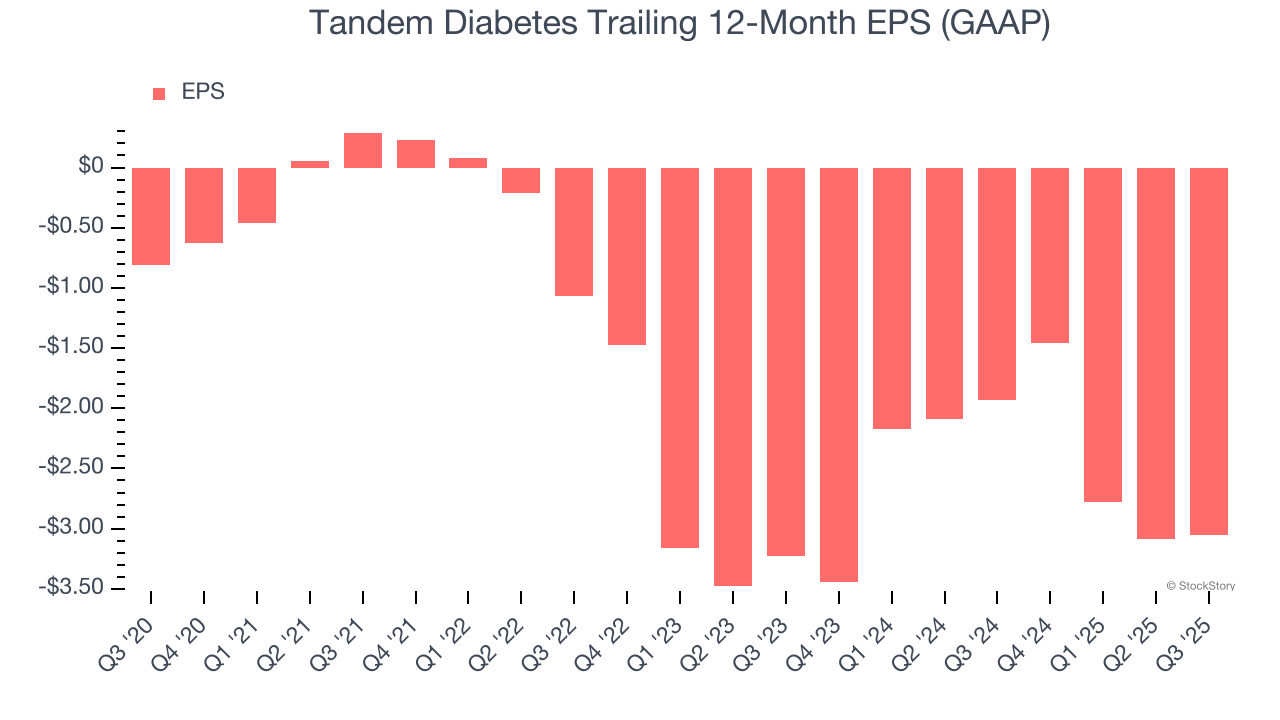
In Q3, Tandem Diabetes reported EPS of negative $0.31, up from negative $0.35 in the same quarter last year. This print beat analysts’ estimates by 3.6%. Over the next 12 months, Wall Street expects Tandem Diabetes to improve its earnings losses. Analysts forecast its full-year EPS of negative $3.05 will advance to negative $1.02.
Key Takeaways from Tandem Diabetes’s Q3 Results
We were impressed by how significantly Tandem Diabetes blew past analysts’ revenue expectations this quarter. We were also glad its EPS outperformed Wall Street’s estimates. Zooming out, we think this quarter featured some important positives. The stock traded up 17.5% to $15.65 immediately after reporting.
Sure, Tandem Diabetes had a solid quarter, but if we look at the bigger picture, is this stock a buy? The latest quarter does matter, but not nearly as much as longer-term fundamentals and valuation, when deciding if the stock is a buy. We cover that in our actionable full research report which you can read here, it’s free for active Edge members.


