
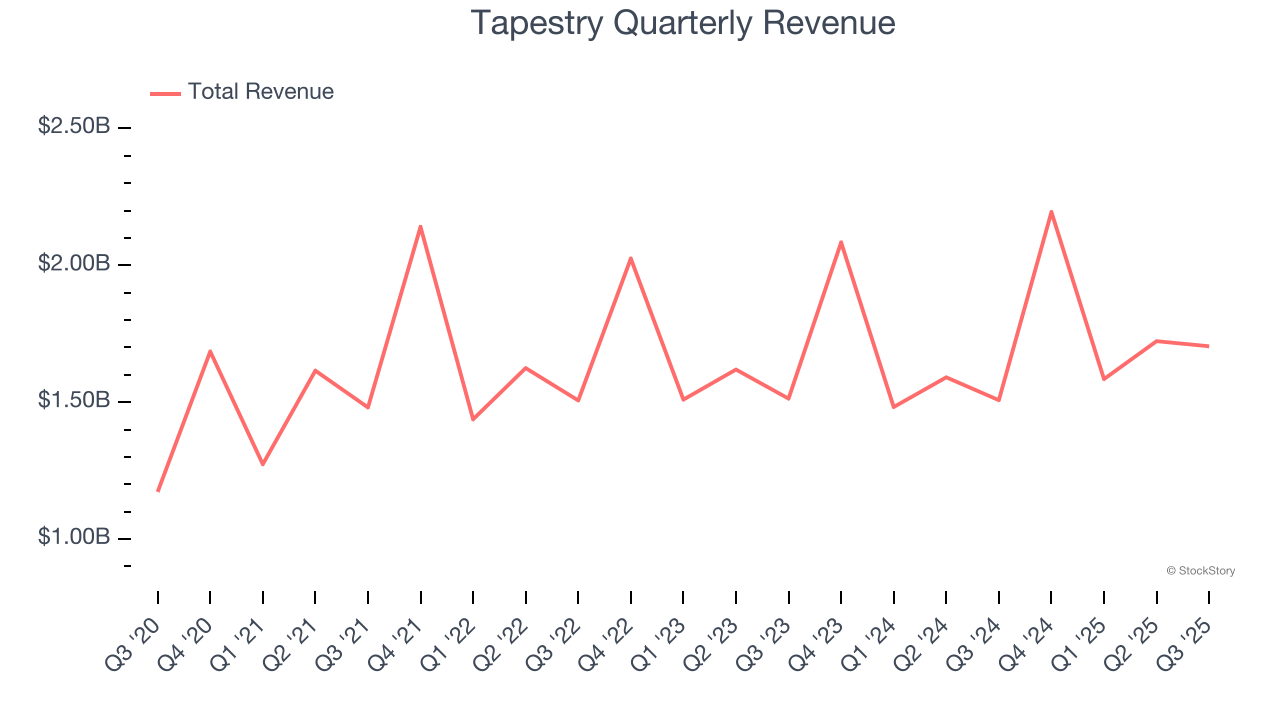
Luxury fashion conglomerate Tapestry (NYSE: TPR) reported Q3 CY2025 results beating Wall Street’s revenue expectations, with sales up 13.1% year on year to $1.70 billion. The company’s full-year revenue guidance of $7.3 billion at the midpoint came in 0.9% above analysts’ estimates. Its GAAP profit of $1.28 per share was 2.6% above analysts’ consensus estimates.
Is now the time to buy Tapestry? Find out by accessing our full research report, it’s free for active Edge members.
Tapestry (TPR) Q3 CY2025 Highlights:
- Revenue: $1.70 billion vs analyst estimates of $1.64 billion (13.1% year-on-year growth, 4.1% beat)
- EPS (GAAP): $1.28 vs analyst estimates of $1.25 (2.6% beat)
- Adjusted EBITDA: $431.2 million vs analyst estimates of $379.1 million (25.3% margin, 13.7% beat)
- The company lifted its revenue guidance for the full year to $7.3 billion at the midpoint from $7.2 billion, a 1.4% increase
- EPS (GAAP) guidance for the full year is $5.53 at the midpoint, roughly in line with what analysts were expecting
- Operating Margin: 19.3%, up from 16.7% in the same quarter last year
- Free Cash Flow Margin: 4.7%, down from 6.2% in the same quarter last year
- Constant Currency Revenue rose 21% year on year (0% in the same quarter last year)
- Market Capitalization: $22.63 billion
Company Overview
Originally founded as Coach, Tapestry (NYSE: TPR) is an American fashion conglomerate with a portfolio of luxury brands offering high-quality accessories and fashion products.
Revenue Growth
Reviewing a company’s long-term sales performance reveals insights into its quality. Any business can have short-term success, but a top-tier one grows for years. Regrettably, Tapestry’s sales grew at a sluggish 8.6% compounded annual growth rate over the last five years. This fell short of our benchmark for the consumer discretionary sector and is a tough starting point for our analysis.
We at StockStory place the most emphasis on long-term growth, but within consumer discretionary, a stretched historical view may miss a company riding a successful new product or trend. Tapestry’s recent performance shows its demand has slowed as its annualized revenue growth of 4% over the last two years was below its five-year trend. 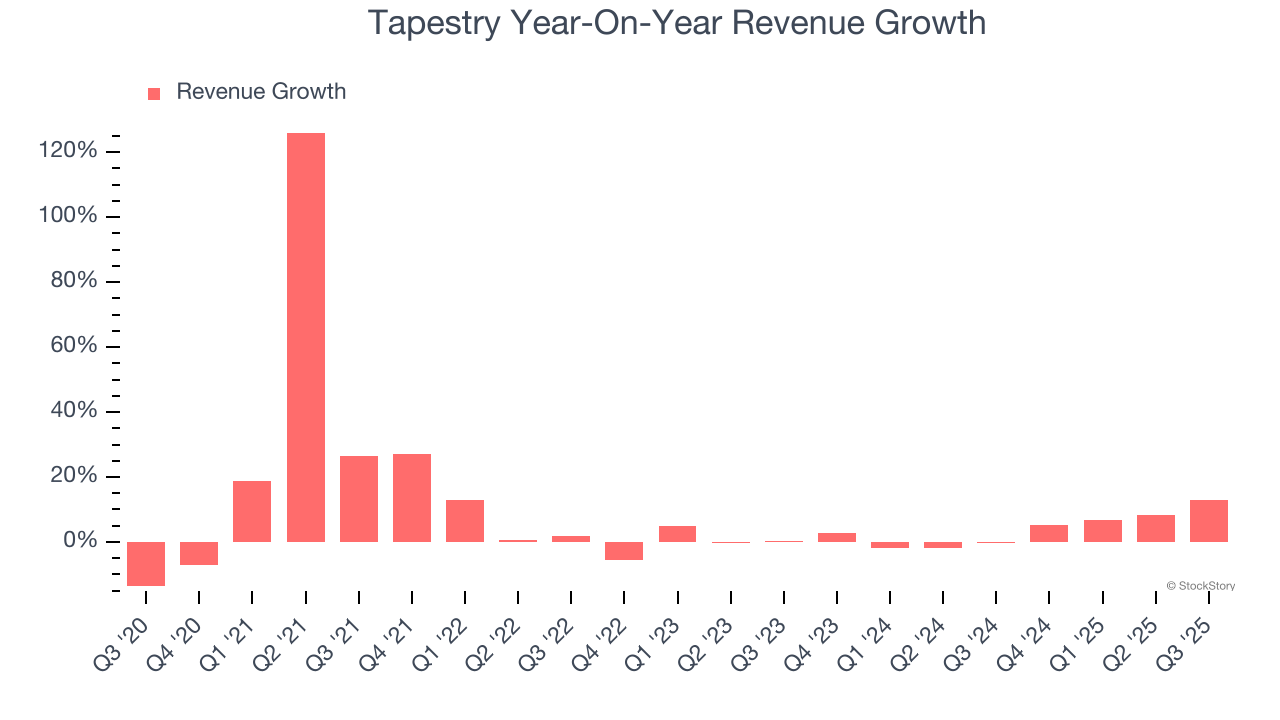
We can dig further into the company’s sales dynamics by analyzing its constant currency revenue, which excludes currency movements that are outside their control and not indicative of demand. Over the last two years, its constant currency sales averaged 5.6% year-on-year growth. Because this number is better than its normal revenue growth, we can see that foreign exchange rates have been a headwind for Tapestry. 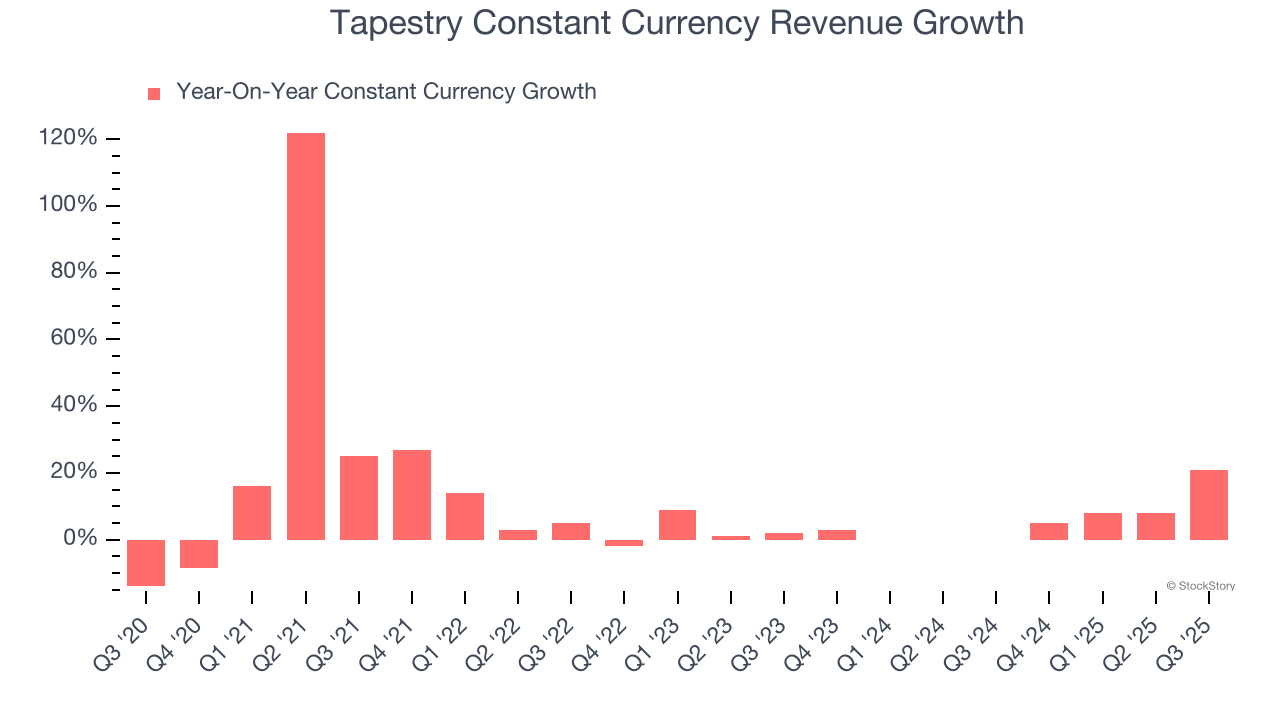
This quarter, Tapestry reported year-on-year revenue growth of 13.1%, and its $1.70 billion of revenue exceeded Wall Street’s estimates by 4.1%.
Looking ahead, sell-side analysts expect revenue to grow 1.2% over the next 12 months, a slight deceleration versus the last two years. This projection doesn't excite us and indicates its products and services will face some demand challenges.
Software is eating the world and there is virtually no industry left that has been untouched by it. That drives increasing demand for tools helping software developers do their jobs, whether it be monitoring critical cloud infrastructure, integrating audio and video functionality, or ensuring smooth content streaming. Click here to access a free report on our 3 favorite stocks to play this generational megatrend.
Operating Margin
Tapestry’s operating margin has been trending down over the last 12 months, but it still averaged 11.7% over the last two years, decent for a consumer discretionary business. This shows it generally does a decent job managing its expenses.
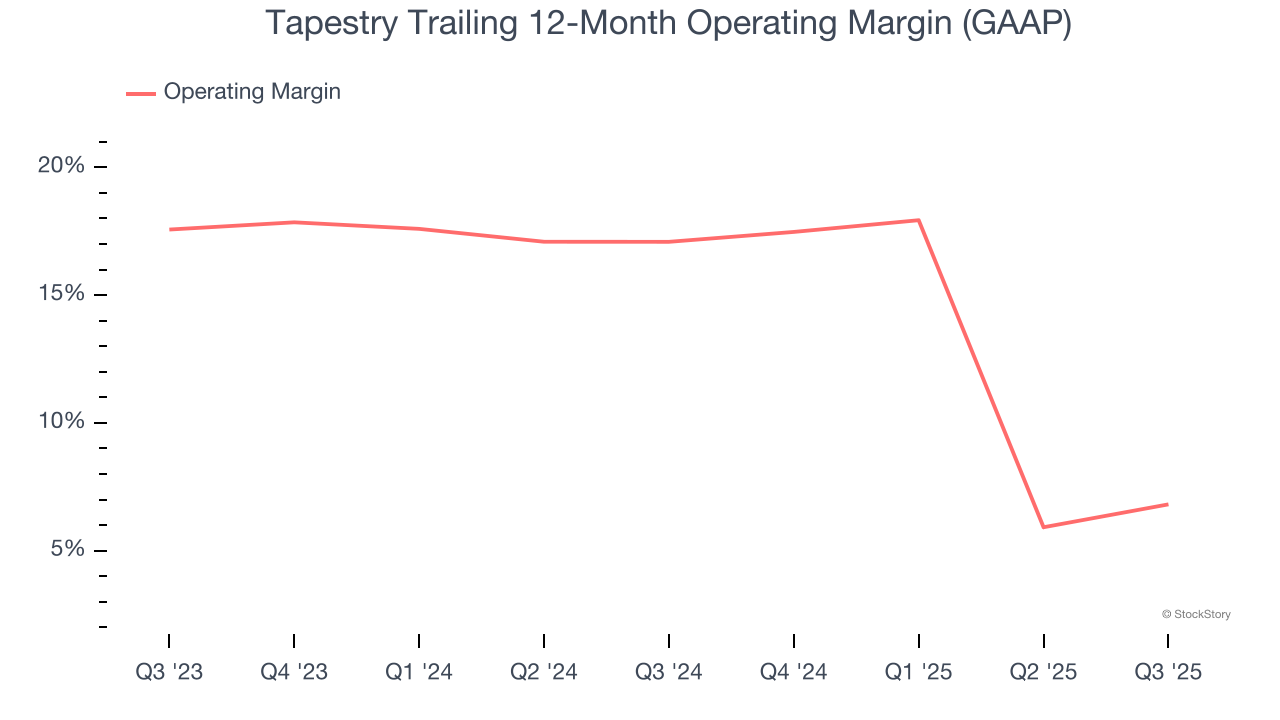
This quarter, Tapestry generated an operating margin profit margin of 19.3%, up 2.5 percentage points year on year. This increase was a welcome development and shows it was more efficient.
Earnings Per Share
Revenue trends explain a company’s historical growth, but the long-term change in earnings per share (EPS) points to the profitability of that growth – for example, a company could inflate its sales through excessive spending on advertising and promotions.
Tapestry’s full-year EPS flipped from negative to positive over the last five years. This is encouraging and shows it’s at a critical moment in its life.
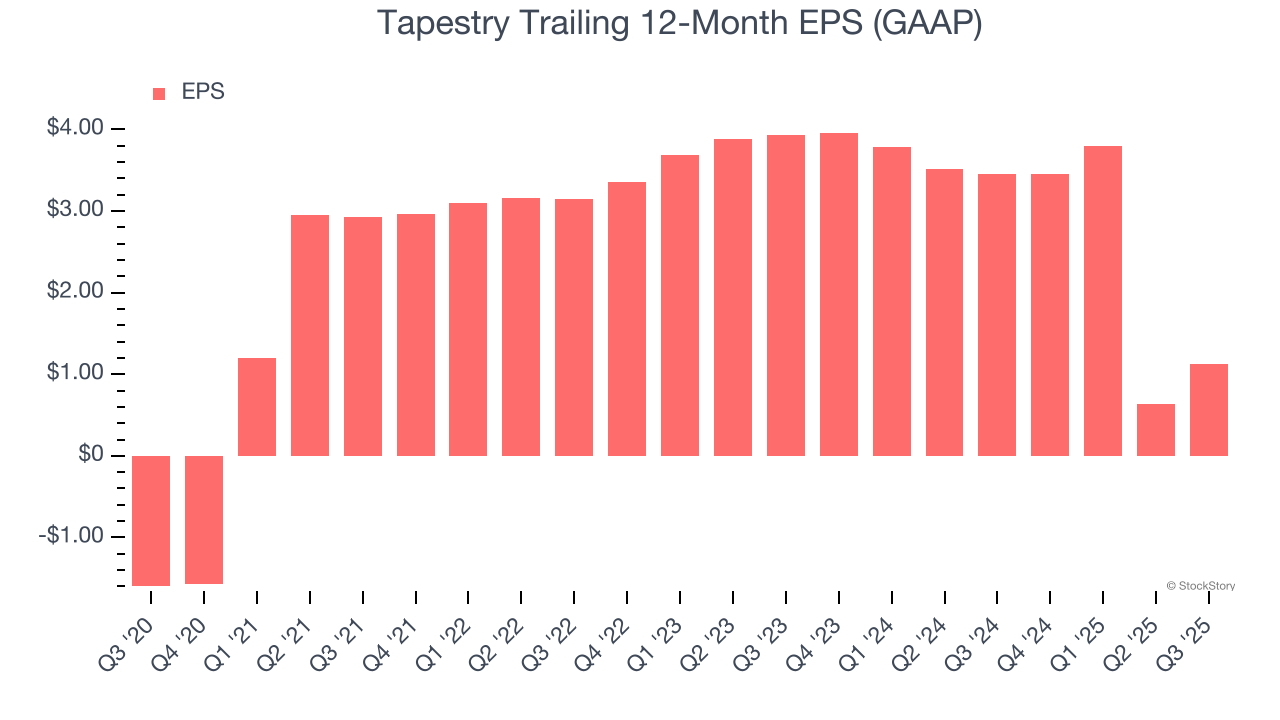
In Q3, Tapestry reported EPS of $1.28, up from $0.79 in the same quarter last year. This print beat analysts’ estimates by 2.6%. Over the next 12 months, Wall Street expects Tapestry’s full-year EPS of $1.12 to grow 386%.
Key Takeaways from Tapestry’s Q3 Results
We were impressed by how significantly Tapestry blew past analysts’ constant currency revenue expectations this quarter. We were also glad its EBITDA outperformed Wall Street’s estimates. Overall, we think this was still a solid quarter with some key areas of upside. The market seemed to be hoping for more, and the stock traded down 13.7% to $94.28 immediately following the results.
Is Tapestry an attractive investment opportunity right now? The latest quarter does matter, but not nearly as much as longer-term fundamentals and valuation, when deciding if the stock is a buy. We cover that in our actionable full research report which you can read here, it’s free for active Edge members.


