
Medical technology company Teleflex (NYSE: TFX) reported Q3 CY2025 results topping the market’s revenue expectations, with sales up 19.4% year on year to $913 million. Its non-GAAP profit of $3.67 per share was 8.6% above analysts’ consensus estimates.
Is now the time to buy Teleflex? Find out by accessing our full research report, it’s free for active Edge members.
Teleflex (TFX) Q3 CY2025 Highlights:
- Revenue: $913 million vs analyst estimates of $892.5 million (19.4% year-on-year growth, 2.3% beat)
- Adjusted EPS: $3.67 vs analyst estimates of $3.38 (8.6% beat)
- Management reiterated its full-year Adjusted EPS guidance of $14.10 at the midpoint
- Operating Margin: -44.8%, down from 19.5% in the same quarter last year
- Free Cash Flow Margin: 8.5%, down from 27.5% in the same quarter last year
- Constant Currency Revenue rose 15.3% year on year (2.2% in the same quarter last year)
- Market Capitalization: $5.51 billion
"We executed well in the third quarter, delivering adjusted operating margin and earnings per share above our expectations and revenue at the midpoint of our guidance range, despite lower than expected order rates in our intra-aortic balloon pump portfolio," said Liam Kelly, Teleflex's Chairman, President and Chief Executive Officer.
Company Overview
With a portfolio spanning from vascular access catheters to minimally invasive surgical tools, Teleflex (NYSE: TFX) designs, manufactures, and supplies single-use medical devices used in critical care and surgical procedures across hospitals worldwide.
Revenue Growth
Reviewing a company’s long-term sales performance reveals insights into its quality. Any business can have short-term success, but a top-tier one grows for years. Over the last five years, Teleflex grew its sales at a mediocre 4.9% compounded annual growth rate. This fell short of our benchmark for the healthcare sector and is a tough starting point for our analysis.
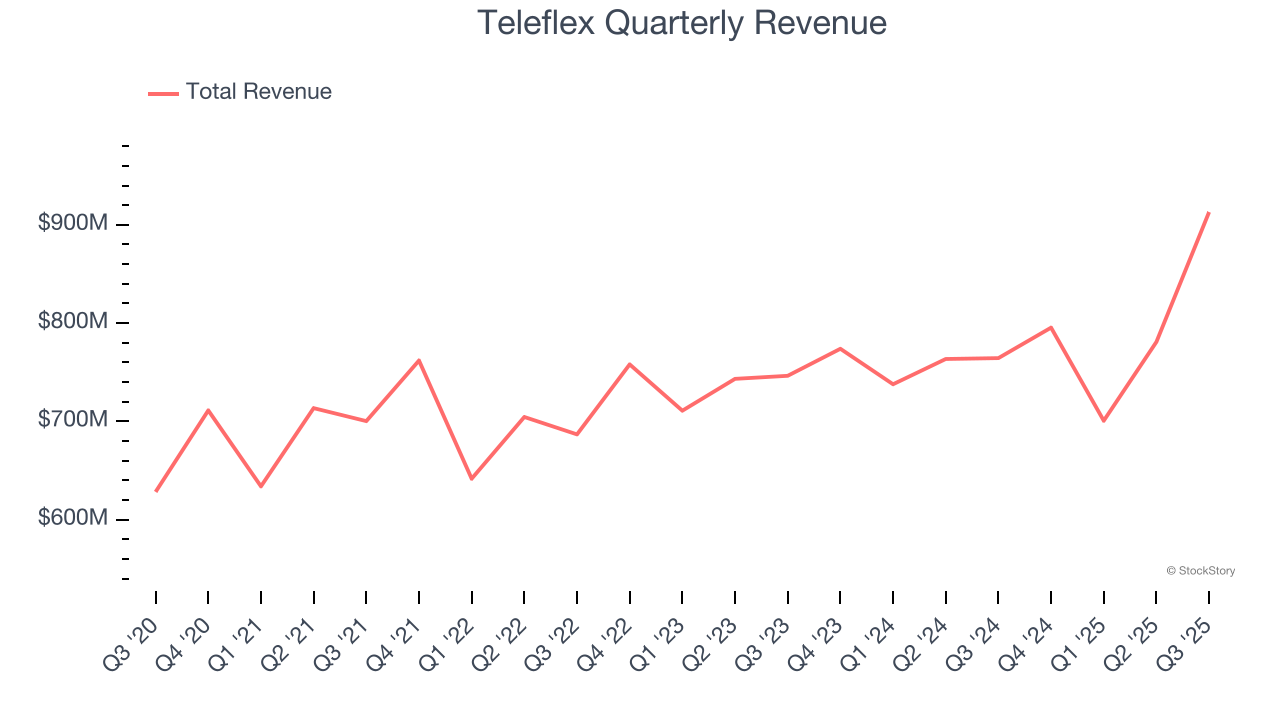
Long-term growth is the most important, but within healthcare, a half-decade historical view may miss new innovations or demand cycles. Teleflex’s recent performance shows its demand has slowed as its annualized revenue growth of 3.8% over the last two years was below its five-year trend. 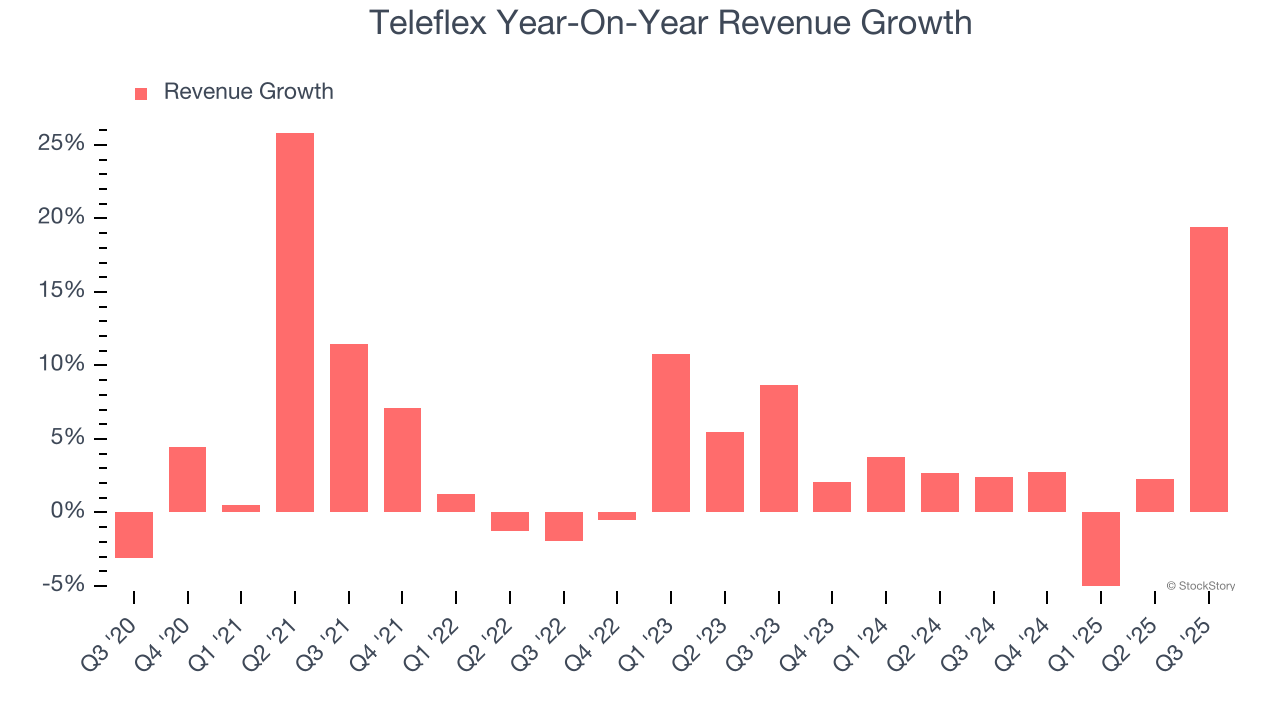
We can dig further into the company’s sales dynamics by analyzing its constant currency revenue, which excludes currency movements that are outside their control and not indicative of demand. Over the last two years, its constant currency sales averaged 3% year-on-year growth. Because this number aligns with its normal revenue growth, we can see that Teleflex has properly hedged its foreign currency exposure. 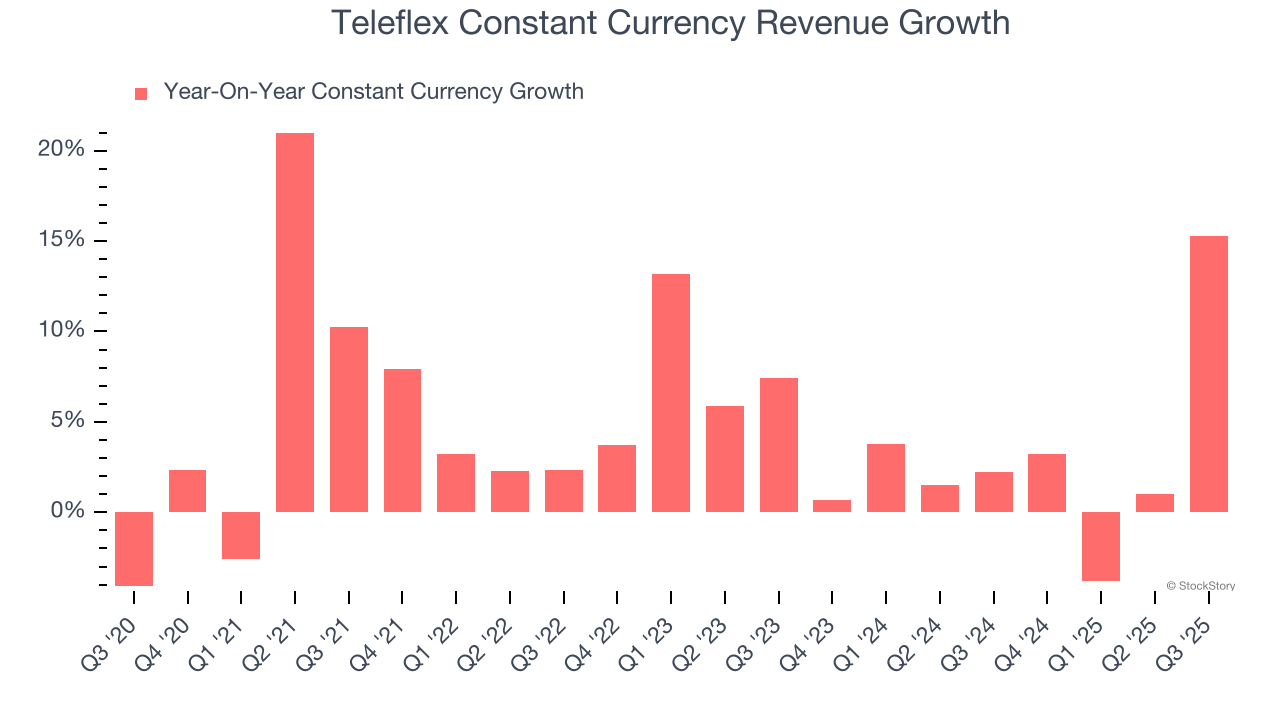
This quarter, Teleflex reported year-on-year revenue growth of 19.4%, and its $913 million of revenue exceeded Wall Street’s estimates by 2.3%.
Looking ahead, sell-side analysts expect revenue to grow 14.1% over the next 12 months, an improvement versus the last two years. This projection is noteworthy and suggests its newer products and services will catalyze better top-line performance.
Software is eating the world and there is virtually no industry left that has been untouched by it. That drives increasing demand for tools helping software developers do their jobs, whether it be monitoring critical cloud infrastructure, integrating audio and video functionality, or ensuring smooth content streaming. Click here to access a free report on our 3 favorite stocks to play this generational megatrend.
Operating Margin
Teleflex has done a decent job managing its cost base over the last five years. The company has produced an average operating margin of 11.9%, higher than the broader healthcare sector.
Looking at the trend in its profitability, Teleflex’s operating margin decreased by 28.1 percentage points over the last five years. The company’s two-year trajectory also shows it failed to get its profitability back to the peak as its margin fell by 26.1 percentage points. This performance was poor no matter how you look at it - it shows its expenses were rising and it couldn’t pass those costs onto its customers.
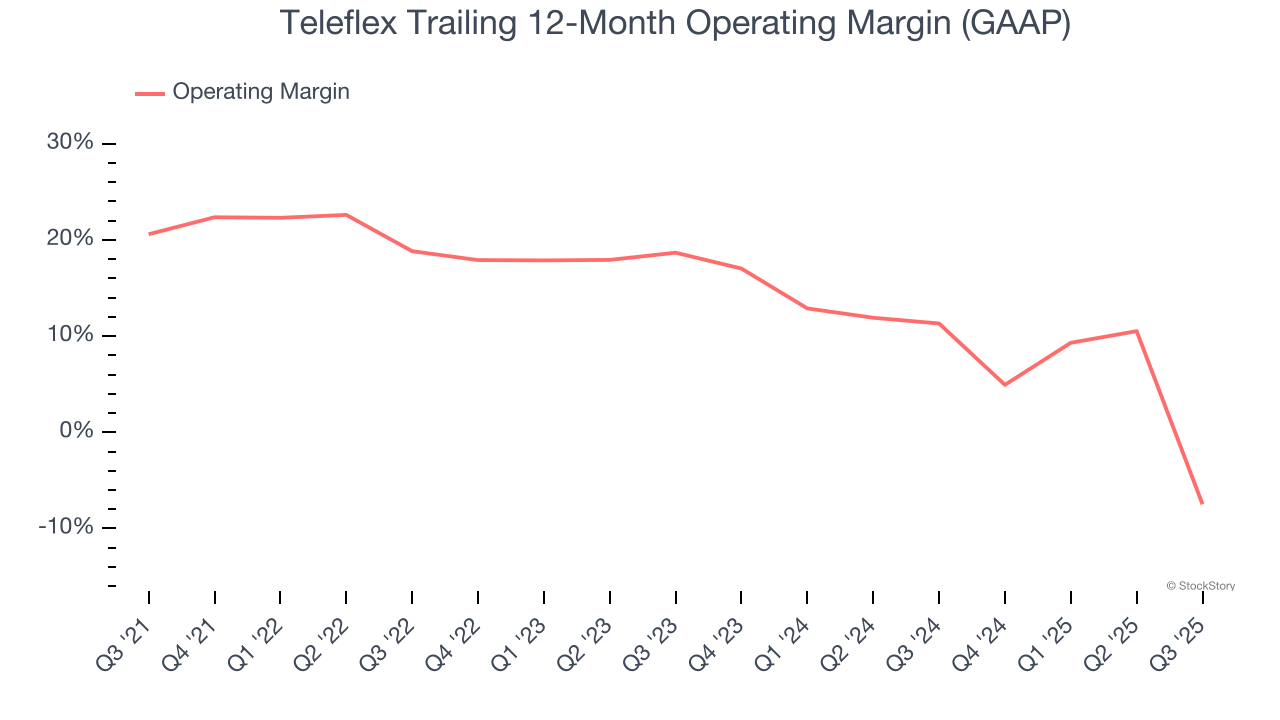
This quarter, Teleflex generated an operating margin profit margin of negative 44.8%, down 64.3 percentage points year on year. This contraction shows it was less efficient because its expenses grew faster than its revenue.
Earnings Per Share
Revenue trends explain a company’s historical growth, but the long-term change in earnings per share (EPS) points to the profitability of that growth – for example, a company could inflate its sales through excessive spending on advertising and promotions.
Teleflex’s decent 5.8% annual EPS growth over the last five years aligns with its revenue performance. This tells us it maintained its per-share profitability as it expanded.
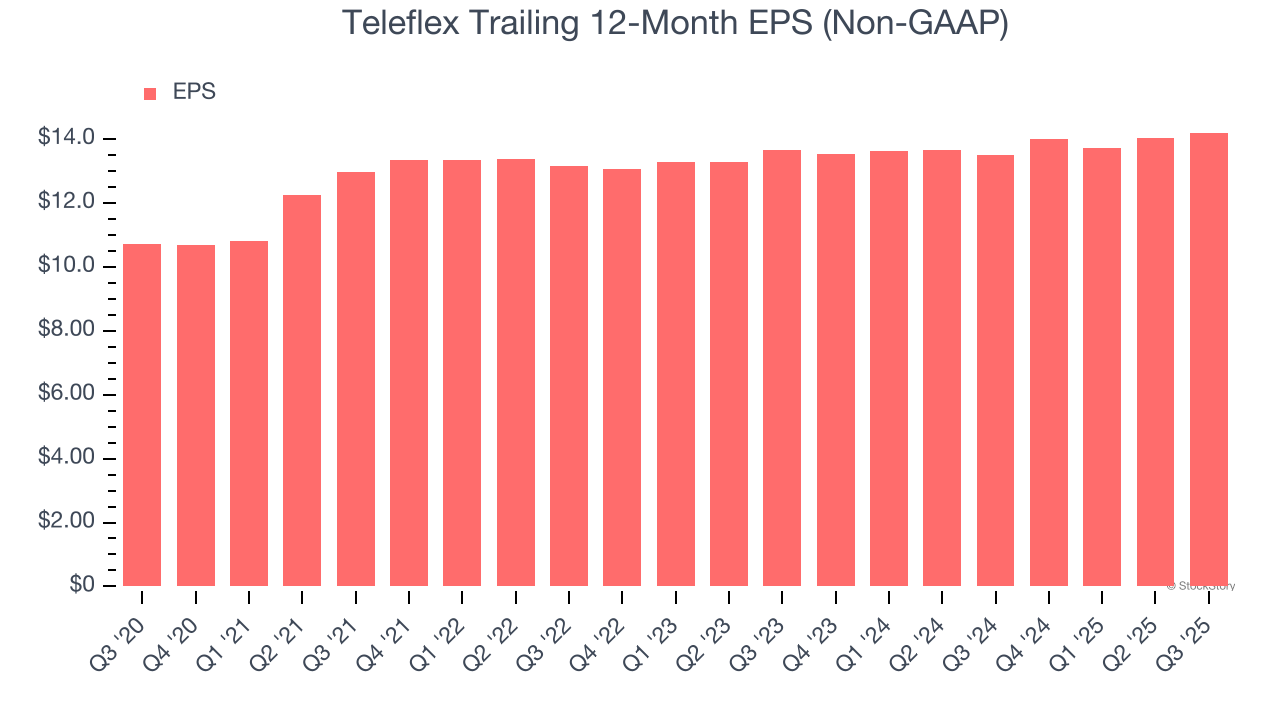
In Q3, Teleflex reported adjusted EPS of $3.67, up from $3.49 in the same quarter last year. This print beat analysts’ estimates by 8.6%. Over the next 12 months, Wall Street expects Teleflex’s full-year EPS of $14.20 to grow 3.9%.
Key Takeaways from Teleflex’s Q3 Results
It was encouraging to see Teleflex beat analysts’ revenue expectations this quarter. We were also glad its EPS outperformed Wall Street’s estimates. Overall, this print had some key positives. The stock remained flat at $125 immediately after reporting.
Indeed, Teleflex had a rock-solid quarterly earnings result, but is this stock a good investment here? What happened in the latest quarter matters, but not as much as longer-term business quality and valuation, when deciding whether to invest in this stock. We cover that in our actionable full research report which you can read here, it’s free for active Edge members.