
Restaurant company Texas Roadhouse (NASDAQ: TXRH) reported Q3 CY2025 results beating Wall Street’s revenue expectations, with sales up 12.8% year on year to $1.44 billion. Its GAAP profit of $1.25 per share was 3% below analysts’ consensus estimates.
Is now the time to buy Texas Roadhouse? Find out by accessing our full research report, it’s free for active Edge members.
Texas Roadhouse (TXRH) Q3 CY2025 Highlights:
- Revenue: $1.44 billion vs analyst estimates of $1.43 billion (12.8% year-on-year growth, 0.7% beat)
- EPS (GAAP): $1.25 vs analyst expectations of $1.29 (3% miss)
- Adjusted EBITDA: $149.6 million vs analyst estimates of $152.9 million (10.4% margin, 2.2% miss)
- Operating Margin: 6.7%, down from 8% in the same quarter last year
- Free Cash Flow Margin: 1%, down from 3.7% in the same quarter last year
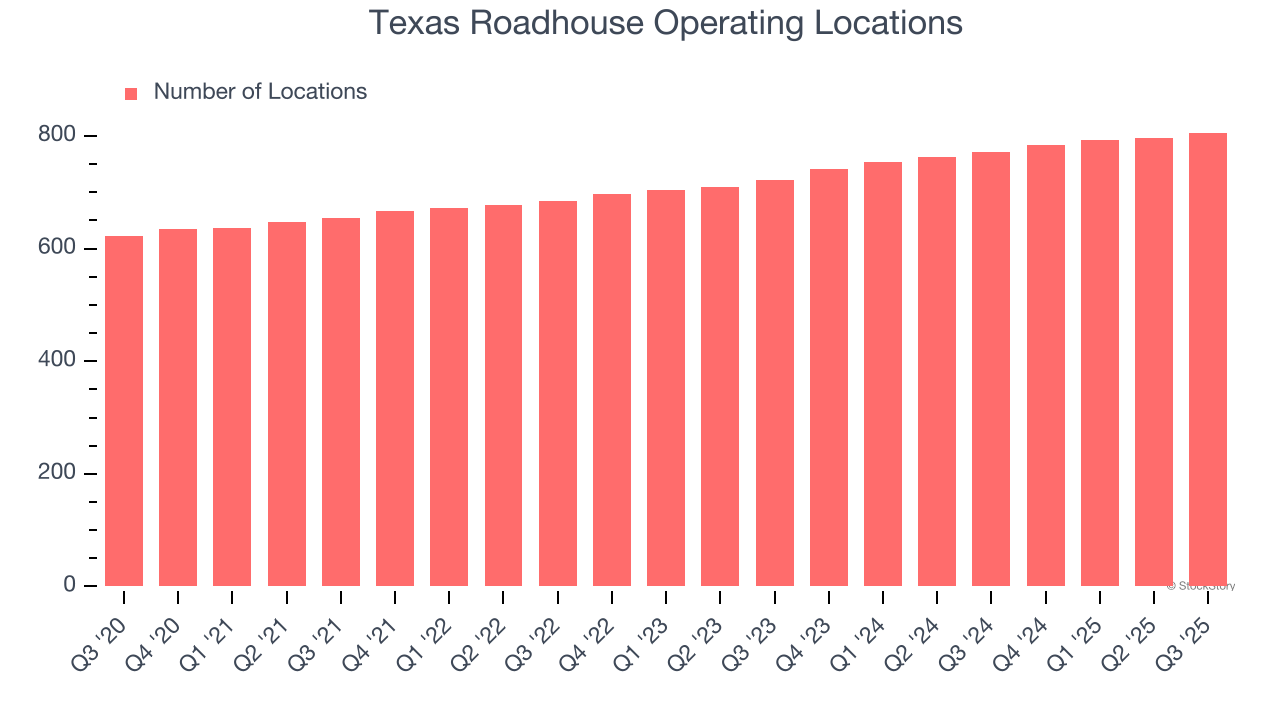
- Locations: 806 at quarter end, up from 772 in the same quarter last year
- Same-Store Sales rose 6.3% year on year (8.2% in the same quarter last year)
- Market Capitalization: $11.01 billion
Jerry Morgan, Chief Executive Officer of Texas Roadhouse, Inc., commented, “Our operators continued to drive strong traffic this quarter, which helped offset the impact of continued commodity inflation. While the duration of these inflationary pressures remains uncertain, we are committed to running our business with a long-term focus and maintaining our value proposition.”
Company Overview
With locations often featuring Western-inspired decor, Texas Roadhouse (NASDAQ: TXRH) is an American restaurant chain specializing in Southern-style cuisine and steaks.
Revenue Growth
Examining a company’s long-term performance can provide clues about its quality. Any business can put up a good quarter or two, but many enduring ones grow for years.
With $5.83 billion in revenue over the past 12 months, Texas Roadhouse is one of the larger restaurant chains in the industry and benefits from a well-known brand that influences consumer purchasing decisions.
As you can see below, Texas Roadhouse’s 14.2% annualized revenue growth over the last six years (we compare to 2019 to normalize for COVID-19 impacts) was impressive as it opened new restaurants and increased sales at existing, established dining locations.
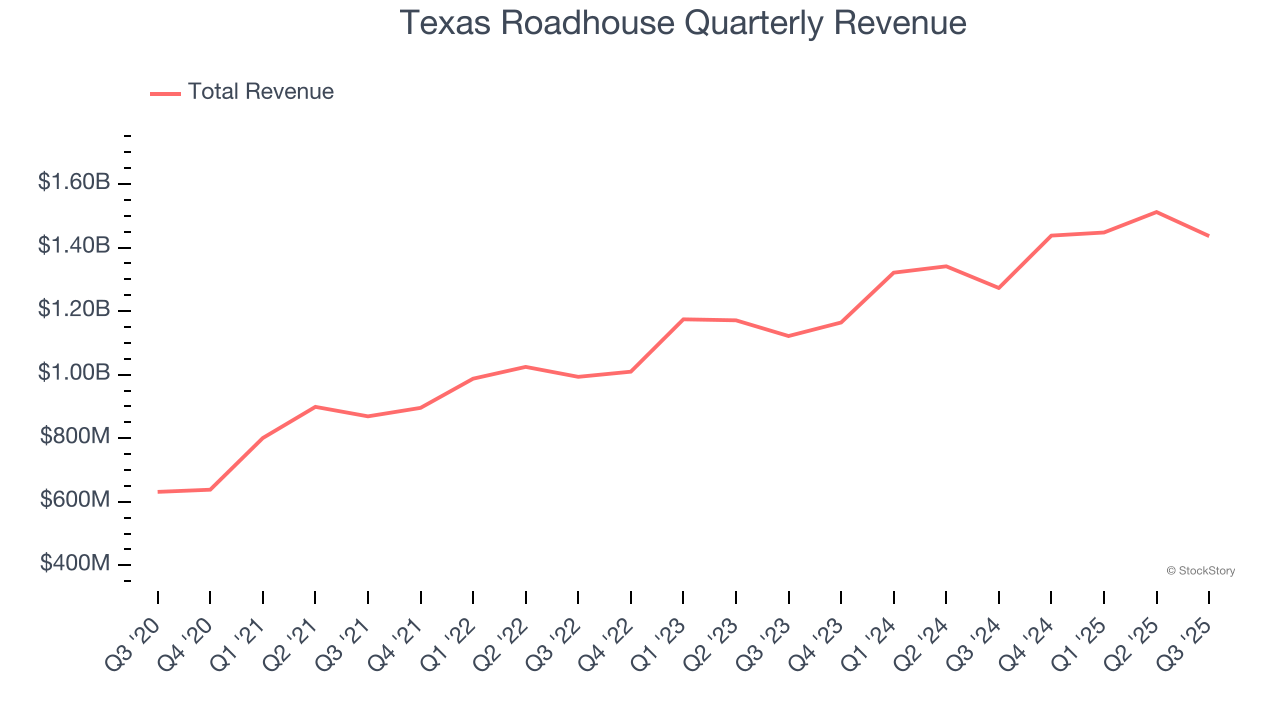
This quarter, Texas Roadhouse reported year-on-year revenue growth of 12.8%, and its $1.44 billion of revenue exceeded Wall Street’s estimates by 0.7%.
Looking ahead, sell-side analysts expect revenue to grow 8.4% over the next 12 months, a deceleration versus the last six years. Despite the slowdown, this projection is above average for the sector and indicates the market is baking in some success for its newer menu offerings.
While Wall Street chases Nvidia at all-time highs, an under-the-radar semiconductor supplier is dominating a critical AI component these giants can’t build without. Click here to access our free report one of our favorites growth stories.
Restaurant Performance
Number of Restaurants
Texas Roadhouse sported 806 locations in the latest quarter. Over the last two years, it has opened new restaurants at a rapid clip by averaging 6% annual growth, among the fastest in the restaurant sector.
When a chain opens new restaurants, it usually means it’s investing for growth because there’s healthy demand for its meals and there are markets where its concepts have few or no locations.
Same-Store Sales
The change in a company's restaurant base only tells one side of the story. The other is the performance of its existing locations, which informs management teams whether they should expand or downsize their physical footprints. Same-store sales is an industry measure of whether revenue is growing at those existing restaurants and is driven by customer visits (often called traffic) and the average spending per customer (ticket).
Texas Roadhouse has been one of the most successful restaurant chains over the last two years thanks to skyrocketing demand within its existing dining locations. On average, the company has posted exceptional year-on-year same-store sales growth of 7.3%. This performance suggests its rollout of new restaurants is beneficial for shareholders. We like this backdrop because it gives Texas Roadhouse multiple ways to win: revenue growth can come from new restaurants or increased foot traffic and higher sales per customer at existing locations.
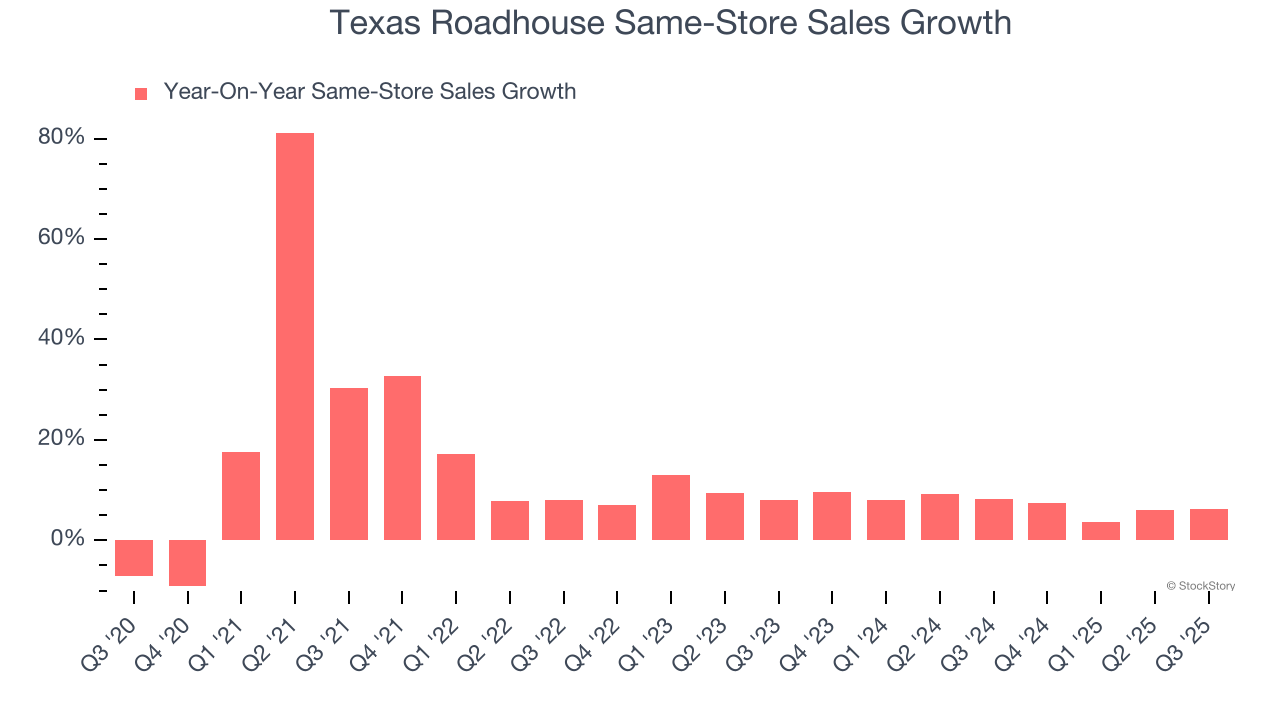
In the latest quarter, Texas Roadhouse’s same-store sales rose 6.3% year on year. This performance was more or less in line with its historical levels.
Key Takeaways from Texas Roadhouse’s Q3 Results
We enjoyed seeing Texas Roadhouse beat analysts’ same-store sales expectations this quarter. We were also happy its revenue narrowly outperformed Wall Street’s estimates. On the other hand, its EBITDA missed and its EPS fell short of Wall Street’s estimates. Zooming out, we think this was a mixed quarter. The stock remained flat at $161 immediately after reporting.
Big picture, is Texas Roadhouse a buy here and now? We think that the latest quarter is only one piece of the longer-term business quality puzzle. Quality, when combined with valuation, can help determine if the stock is a buy. We cover that in our actionable full research report which you can read here, it’s free for active Edge members.