
Commercial real estate finance company Walker & Dunlop (NYSE: WD) reported revenue ahead of Wall Streets expectations in Q3 CY2025, with sales up 15.5% year on year to $337.7 million. Its non-GAAP profit of $1.22 per share was 1.9% above analysts’ consensus estimates.
Is now the time to buy Walker & Dunlop? Find out by accessing our full research report, it’s free for active Edge members.
Walker & Dunlop (WD) Q3 CY2025 Highlights:
Company Overview
Originating as a small mortgage banking firm during the Great Depression in 1937, Walker & Dunlop (NYSE: WD) provides commercial real estate financing, property sales, appraisal, and investment management services with a focus on multifamily properties.
Sales Growth
Two primary revenue streams drive bank earnings. While net interest income, which is earned by charging higher rates on loans than paid on deposits, forms the foundation, fee-based services across banking, credit, wealth management, and trading operations provide additional income. Thankfully, Walker & Dunlop’s 5.4% annualized revenue growth over the last five years was decent. Its growth was slightly above the average banking company and shows its offerings resonate with customers.
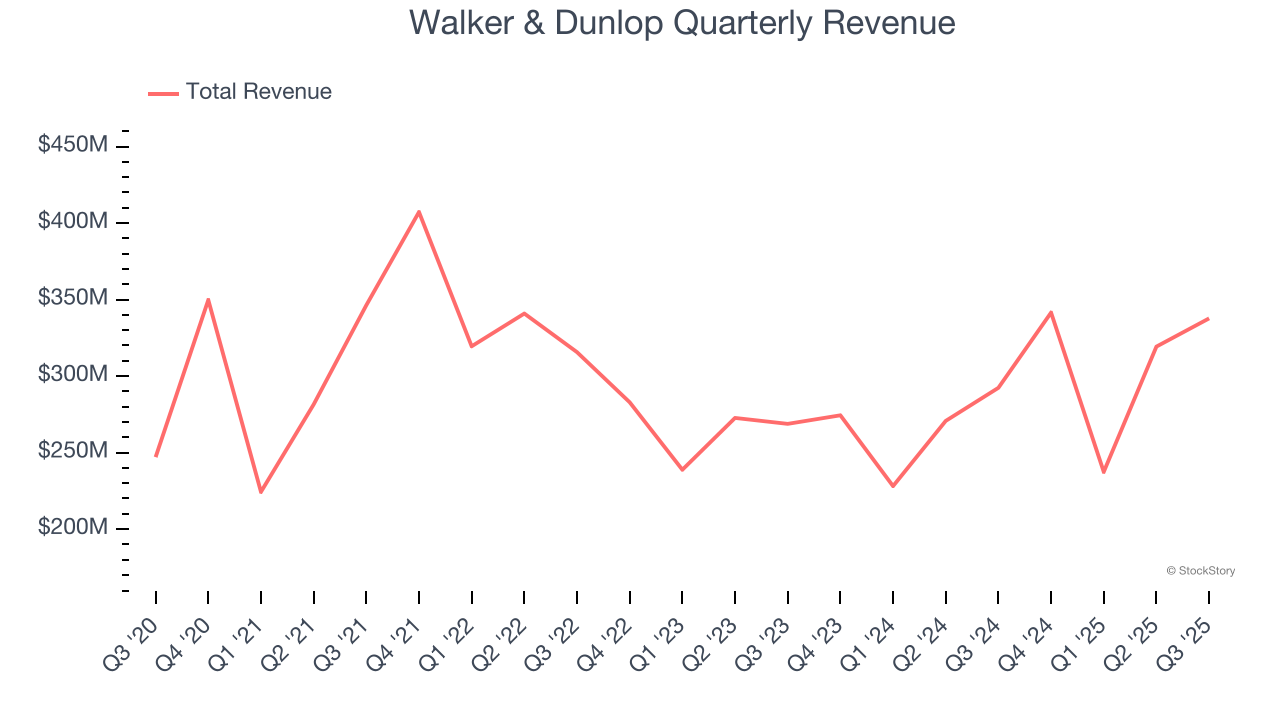
Long-term growth is the most important, but within financials, a half-decade historical view may miss recent interest rate changes and market returns. Walker & Dunlop’s annualized revenue growth of 7.8% over the last two years is above its five-year trend, suggesting its demand recently accelerated. 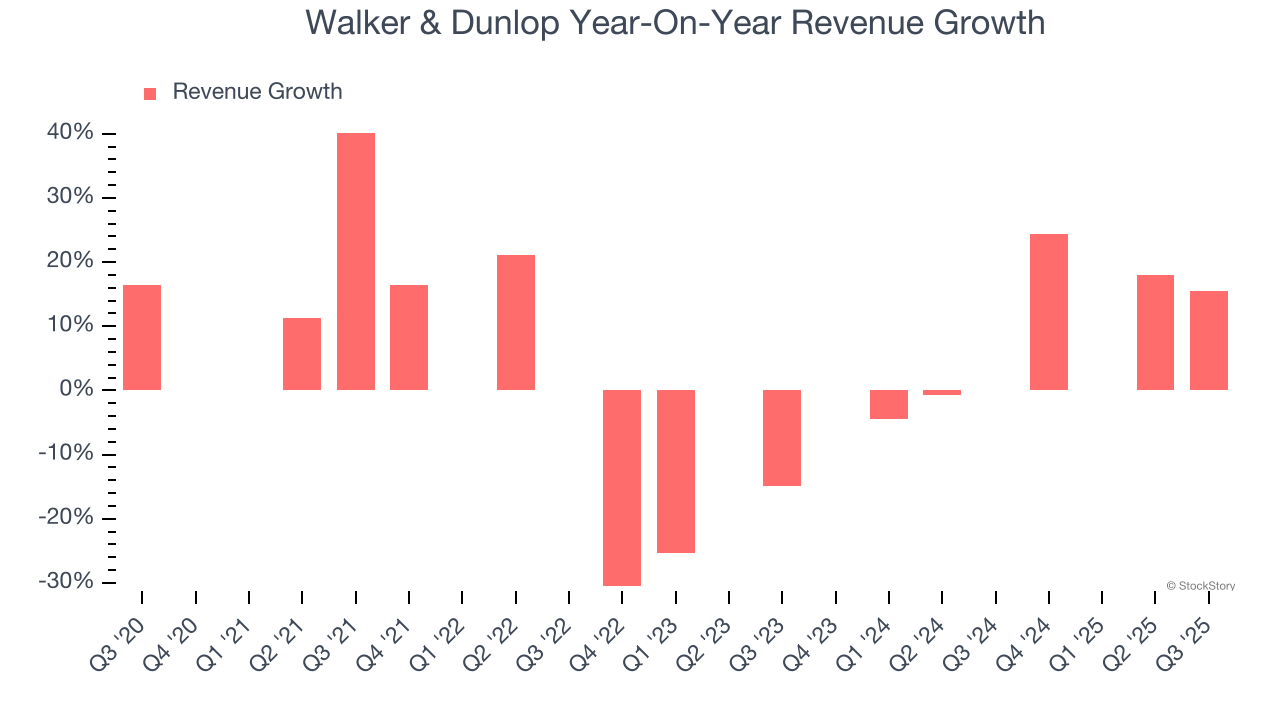 Note: Quarters not shown were determined to be outliers, impacted by outsized investment gains/losses that are not indicative of the recurring fundamentals of the business.
This quarter, Walker & Dunlop reported year-on-year revenue growth of 15.5%, and its $337.7 million of revenue exceeded Wall Street’s estimates by 3.5%.
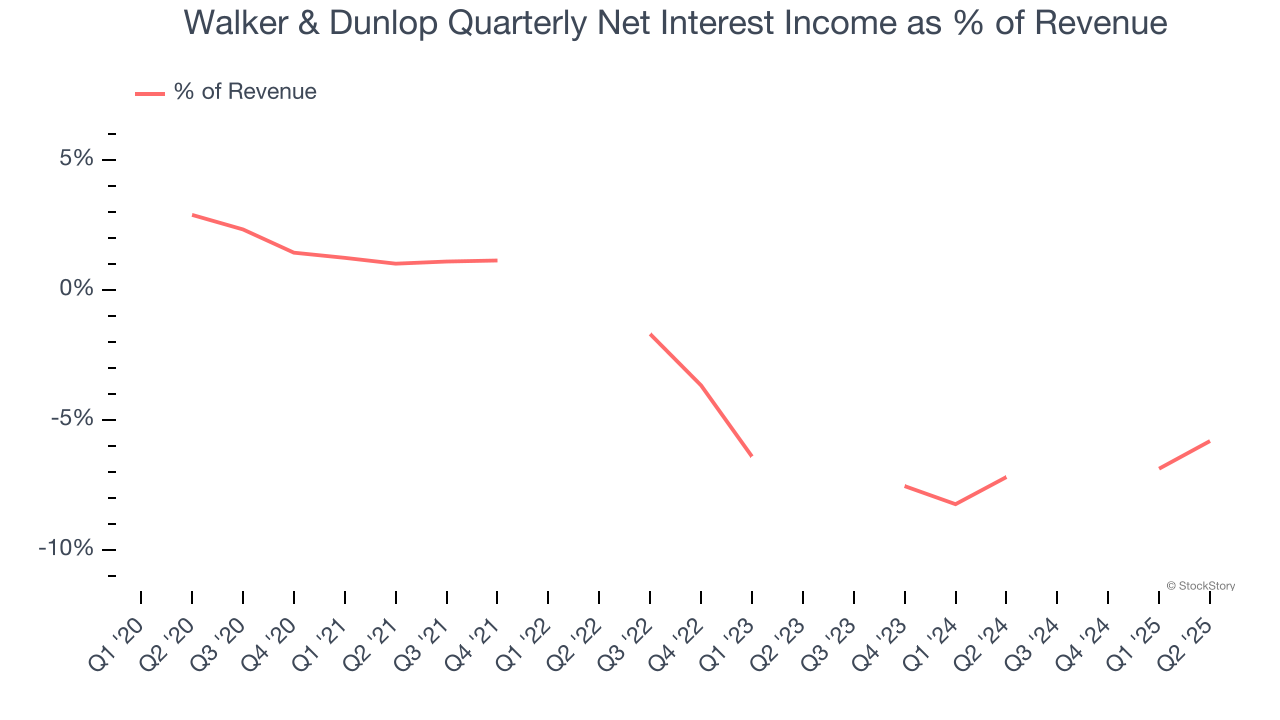
Net interest income made up -3.6% of the company’s total revenue during the last five years, meaning Walker & Dunlop is well diversified and has a variety of income streams driving its overall growth. Nevertheless, net interest income is critical to analyze for banks because they’re considered a higher-quality, more recurring revenue source by investors.
 Note: Quarters not shown were determined to be outliers, impacted by outsized investment gains/losses that are not indicative of the recurring fundamentals of the business.
Software is eating the world and there is virtually no industry left that has been untouched by it. That drives increasing demand for tools helping software developers do their jobs, whether it be monitoring critical cloud infrastructure, integrating audio and video functionality, or ensuring smooth content streaming. Click here to access a free report on our 3 favorite stocks to play this generational megatrend.
Key Takeaways from Walker & Dunlop’s Q3 Results
We enjoyed seeing Walker & Dunlop beat analysts’ revenue expectations this quarter. On the other hand, its EPS slightly beat. Overall, this print had some key positives. The stock remained flat at $79.98 immediately after reporting.
Should you buy the stock or not? When making that decision, it’s important to consider its valuation, business qualities, as well as what has happened in the latest quarter. We cover that in our actionable full research report which you can read here, it’s free for active Edge members.


