
Eyewear retailer Warby Parker (NYSE: WRBY) fell short of the markets revenue expectations in Q3 CY2025, but sales rose 15.2% year on year to $221.7 million. The company’s full-year revenue guidance of $872.5 million at the midpoint came in 1.5% below analysts’ estimates. Its GAAP profit of $0.05 per share was in line with analysts’ consensus estimates.
Is now the time to buy Warby Parker? Find out by accessing our full research report, it’s free for active Edge members.
Warby Parker (WRBY) Q3 CY2025 Highlights:
- Revenue: $221.7 million vs analyst estimates of $224.3 million (15.2% year-on-year growth, 1.2% miss)
- EPS (GAAP): $0.05 vs analyst estimates of $0.05 (in line)
- Adjusted EBITDA: $25.75 million vs analyst estimates of $25.04 million (11.6% margin, 2.8% beat)
- The company dropped its revenue guidance for the full year to $872.5 million at the midpoint from $884 million, a 1.3% decrease
- EBITDA guidance for the full year is $99.5 million at the midpoint, below analyst estimates of $100.8 million
- Operating Margin: 1.6%, up from -3.4% in the same quarter last year
- Free Cash Flow was -$1.52 million, down from $13.06 million in the same quarter last year
- Active Customers: 2.66 million, up 230,000 year on year
- Market Capitalization: $2.32 billion
Company Overview
Founded in 2010, Warby Parker (NYSE: WRBY) designs, manufactures, and sells eyewear, including prescription glasses, sunglasses, and contact lenses, through its e-commerce platform and physical retail locations.
Revenue Growth
A company’s long-term sales performance is one signal of its overall quality. Any business can experience short-term success, but top-performing ones enjoy sustained growth for years.
With $850.6 million in revenue over the past 12 months, Warby Parker is a small retailer, which sometimes brings disadvantages compared to larger competitors benefiting from economies of scale and negotiating leverage with suppliers. On the bright side, it can grow faster because it has more white space to build new stores.
As you can see below, Warby Parker’s sales grew at an impressive 16.1% compounded annual growth rate over the last six years (we compare to 2019 to normalize for COVID-19 impacts) as it opened new stores and expanded its reach.
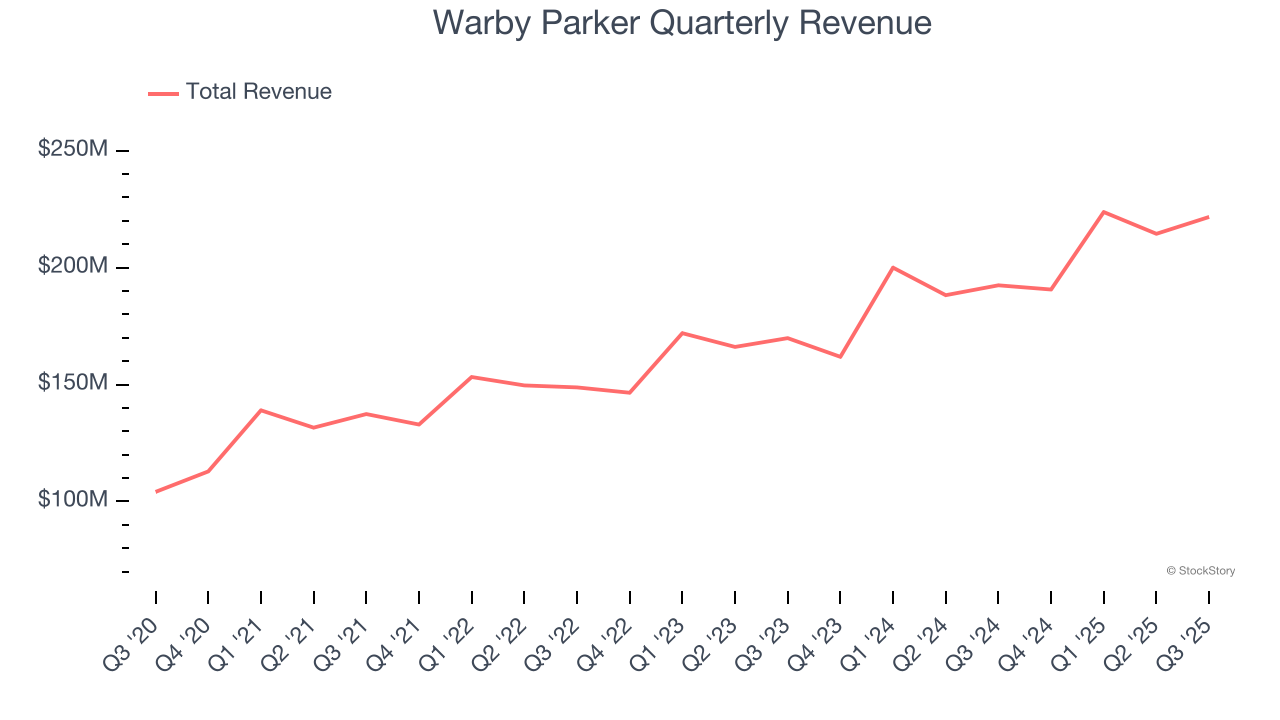
This quarter, Warby Parker’s revenue grew by 15.2% year on year to $221.7 million but fell short of Wall Street’s estimates.
Looking ahead, sell-side analysts expect revenue to grow 15.8% over the next 12 months, similar to its six-year rate. This projection is eye-popping and indicates the market is baking in success for its products.
Microsoft, Alphabet, Coca-Cola, Monster Beverage—all began as under-the-radar growth stories riding a massive trend. We’ve identified the next one: a profitable AI semiconductor play Wall Street is still overlooking. Go here for access to our full report.
Number of Stores
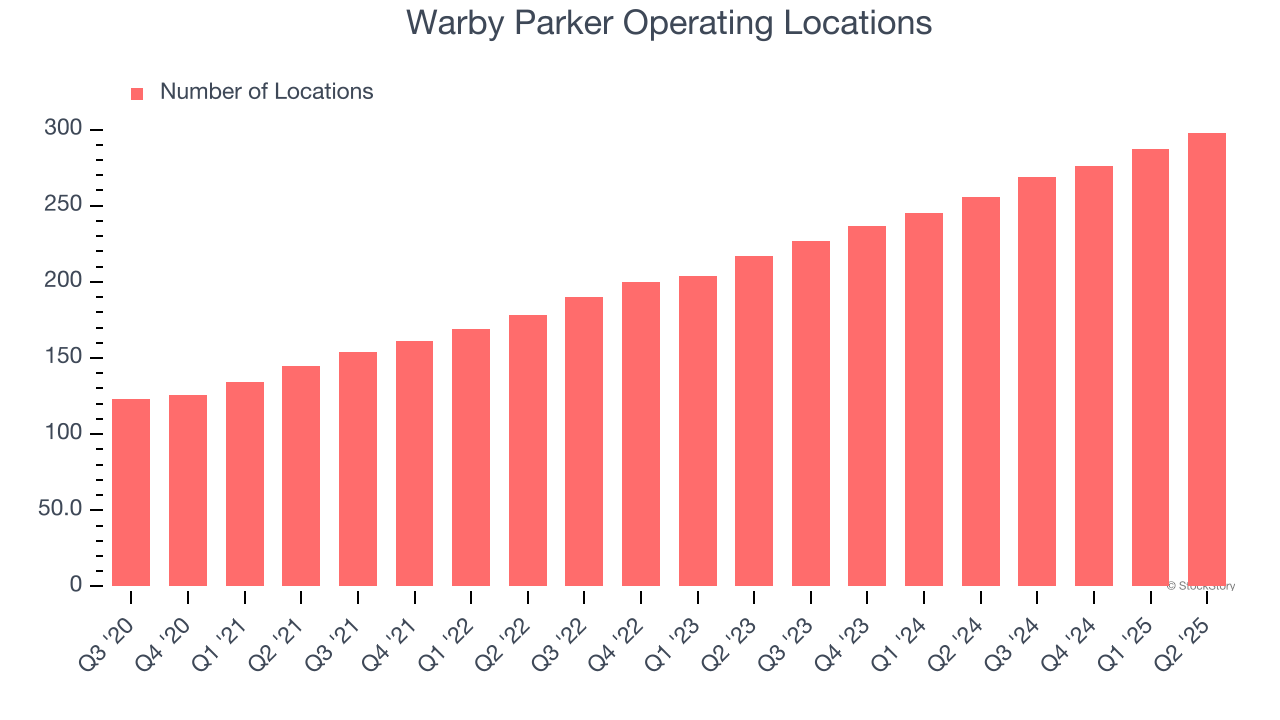
Over the last two years, Warby Parker opened new stores at a rapid clip by averaging 17.9% annual growth, among the fastest in the consumer retail sector. This gives it a chance to scale into a mid-sized business over time.
When a retailer opens new stores, it usually means it’s investing for growth because demand is greater than supply, especially in areas where consumers may not have a store within reasonable driving distance.
Note that Warby Parker reports its store count intermittently, so some data points are missing in the chart below.
Key Takeaways from Warby Parker’s Q3 Results
It was encouraging to see Warby Parker beat analysts’ EBITDA expectations this quarter. We were also happy its gross margin narrowly outperformed Wall Street’s estimates. On the other hand, its full-year revenue guidance missed and its revenue fell slightly short of Wall Street’s estimates. Overall, this was a weaker quarter. The stock traded down 7.2% to $17.67 immediately following the results.
Should you buy the stock or not? We think that the latest quarter is only one piece of the longer-term business quality puzzle. Quality, when combined with valuation, can help determine if the stock is a buy. We cover that in our actionable full research report which you can read here, it’s free for active Edge members.


