Personal wellness company WeightWatchers (NASDAQ: WW) announced better-than-expected revenue in Q3 CY2025, but sales fell by 10.8% year on year to $172.1 million. The company’s full-year revenue guidance of $697.5 million at the midpoint came in 0.8% above analysts’ estimates. Its GAAP loss of $5.76 per share was significantly below analysts’ consensus estimates.
Is now the time to buy WeightWatchers? Find out by accessing our full research report, it’s free for active Edge members.
WeightWatchers (WW) Q3 CY2025 Highlights:
- Revenue: $172.1 million vs analyst estimates of $161.4 million (10.8% year-on-year decline, 6.6% beat)
- EPS (GAAP): -$5.76 vs analyst estimates of -$0.10 (significant miss)
- Adjusted EBITDA: $42.78 million vs analyst estimates of $28.97 million (24.9% margin, 47.7% beat)
- The company slightly lifted its revenue guidance for the full year to $697.5 million at the midpoint from $692.5 million
- EBITDA guidance for the full year is $147.5 million at the midpoint, above analyst estimates of $145.4 million
- Operating Margin: 4.7%, down from 18.6% in the same quarter last year
- Free Cash Flow Margin: 2.8%, down from 8.6% in the same quarter last year
- Market Capitalization: $331.6 million
“WeightWatchers is entering a new era, uniquely positioned at the intersection of medical innovation and behavioral science, to lead this rapidly evolving weight health market,” said Tara Comonte, CEO of WeightWatchers.
Company Overview
Known by many for its old cable television commercials, WeightWatchers (NASDAQ: WW) is a wellness company offering a range of products and services promoting weight loss and healthy habits.
Revenue Growth
Examining a company’s long-term performance can provide clues about its quality. Any business can experience short-term success, but top-performing ones enjoy sustained growth for years. WeightWatchers struggled to consistently generate demand over the last five years as its sales dropped at a 12% annual rate. This was below our standards and is a sign of lacking business quality.
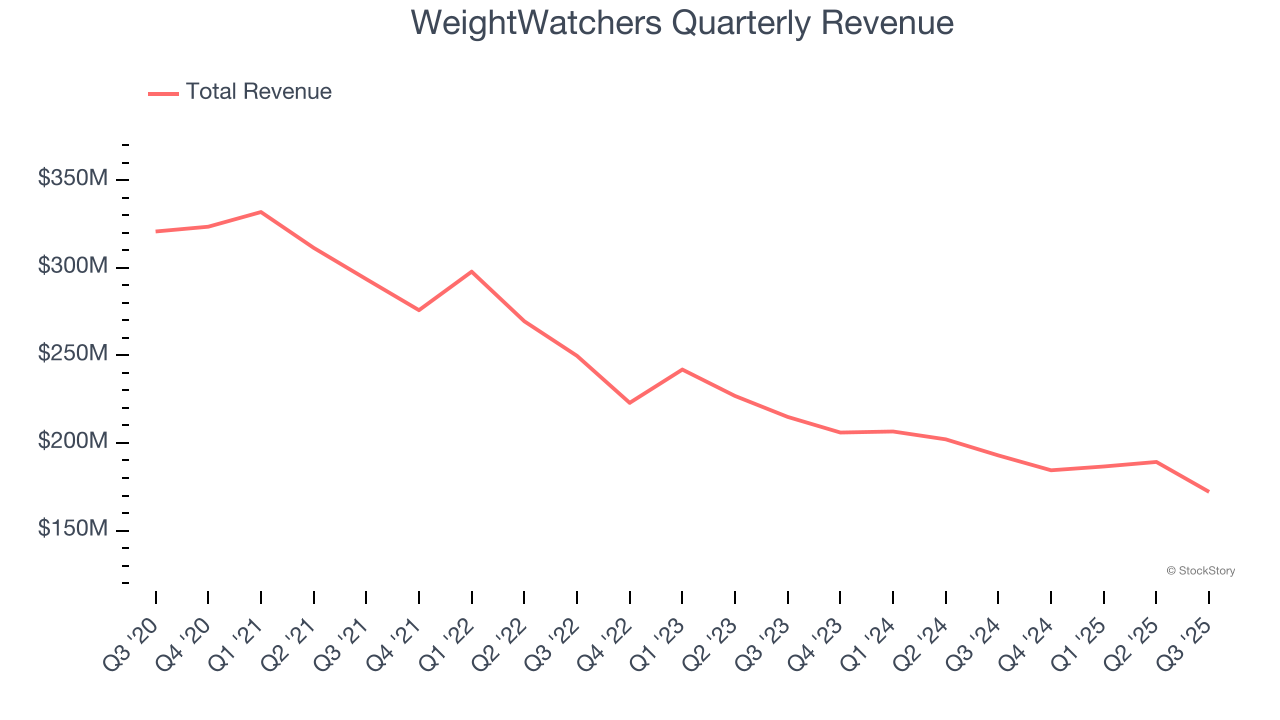
Long-term growth is the most important, but within consumer discretionary, product cycles are short and revenue can be hit-driven due to rapidly changing trends and consumer preferences. WeightWatchers’s annualized revenue declines of 10.1% over the last two years suggest its demand continued shrinking. 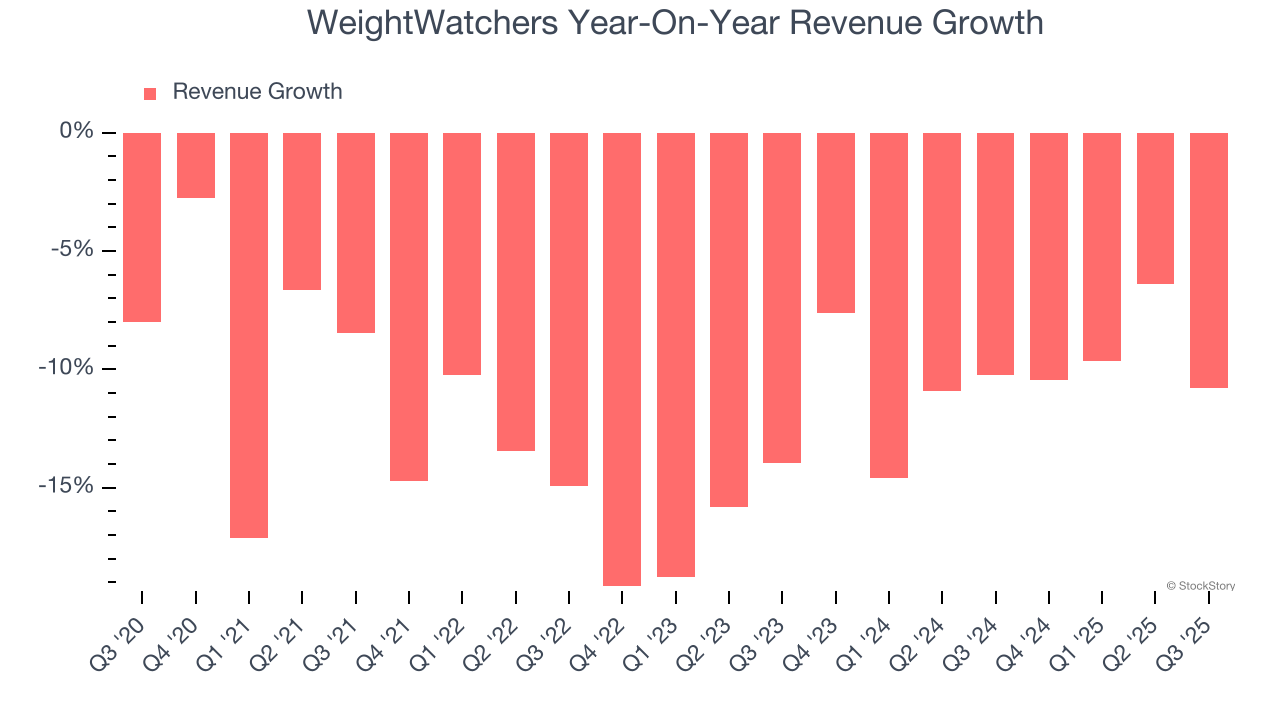
This quarter, WeightWatchers’s revenue fell by 10.8% year on year to $172.1 million but beat Wall Street’s estimates by 6.6%.
Looking ahead, sell-side analysts expect revenue to decline by 13.6% over the next 12 months, a deceleration versus the last two years. This projection is underwhelming and indicates its products and services will face some demand challenges.
Microsoft, Alphabet, Coca-Cola, Monster Beverage—all began as under-the-radar growth stories riding a massive trend. We’ve identified the next one: a profitable AI semiconductor play Wall Street is still overlooking. Go here for access to our full report.
Operating Margin
Operating margin is a key measure of profitability. Think of it as net income - the bottom line - excluding the impact of taxes and interest on debt, which are less connected to business fundamentals.
WeightWatchers’s operating margin has risen over the last 12 months and averaged 11.7% over the last two years. Its profitability was higher than the broader consumer discretionary sector, showing it did a decent job managing its expenses.
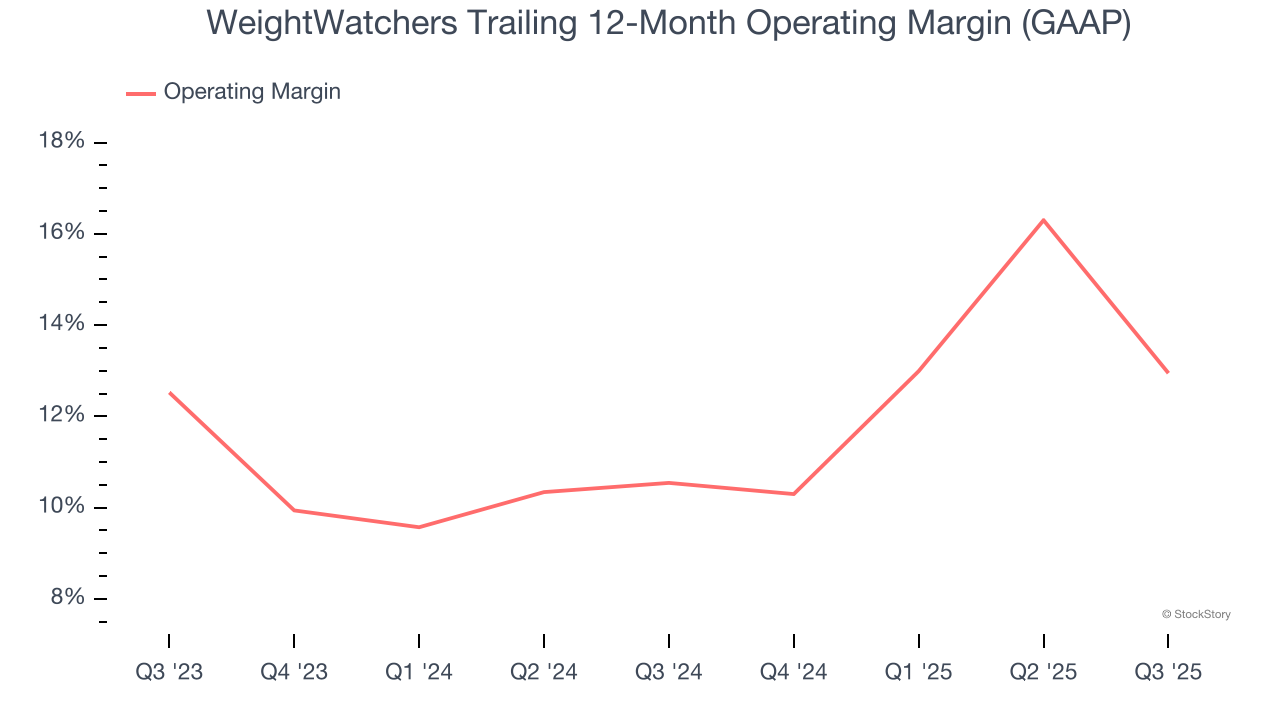
This quarter, WeightWatchers generated an operating margin profit margin of 4.7%, down 14 percentage points year on year. This contraction shows it was less efficient because its expenses increased relative to its revenue.
Earnings Per Share
Revenue trends explain a company’s historical growth, but the long-term change in earnings per share (EPS) points to the profitability of that growth – for example, a company could inflate its sales through excessive spending on advertising and promotions.
WeightWatchers’s EPS grew at an astounding 45.1% compounded annual growth rate over the last five years, higher than its 12% annualized revenue declines. However, this alone doesn’t tell us much about its business quality because its operating margin didn’t improve.
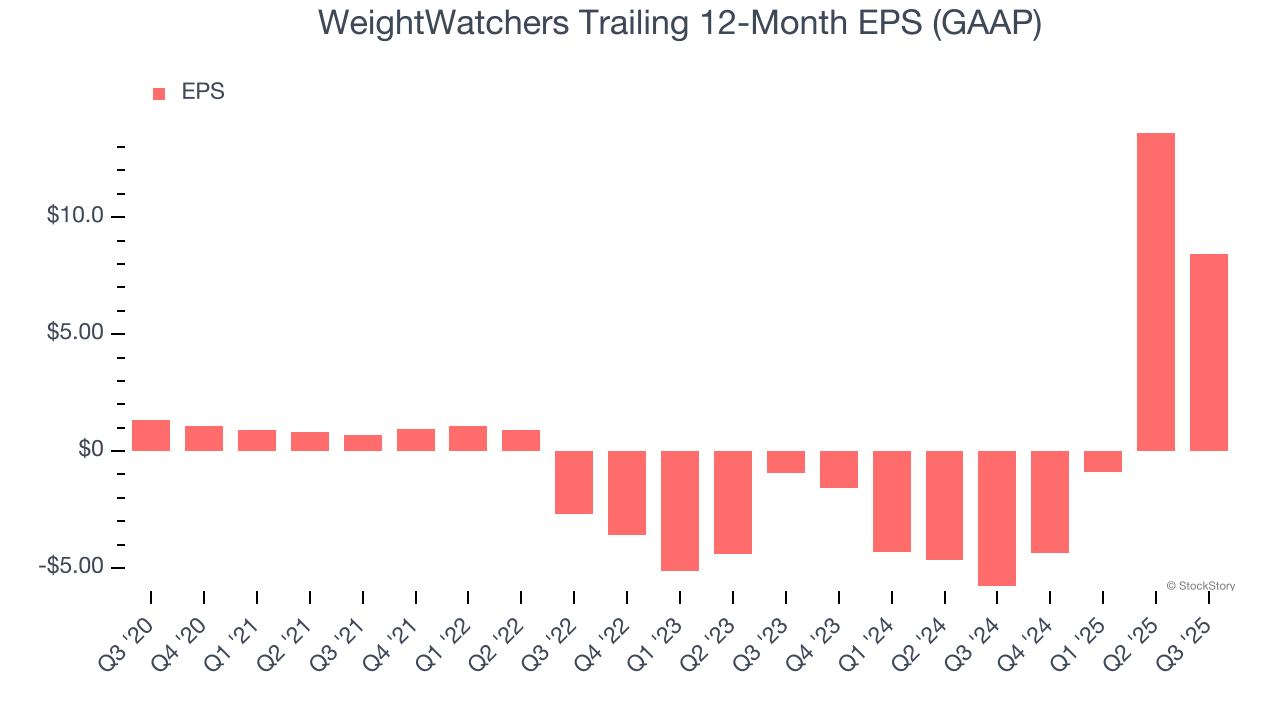
In Q3, WeightWatchers reported EPS of negative $5.76, down from negative $0.58 in the same quarter last year. This print missed analysts’ estimates, but we care more about long-term EPS growth than short-term movements. Over the next 12 months, Wall Street expects WeightWatchers’s full-year EPS of $8.44 to shrink by 81.1%.
Key Takeaways from WeightWatchers’s Q3 Results
We were impressed by how significantly WeightWatchers blew past analysts’ EBITDA expectations this quarter. We were also glad its revenue outperformed Wall Street’s estimates. On the other hand, its EPS missed. Overall, this print had some key positives. The stock traded up 5.5% to $35.01 immediately following the results.
Sure, WeightWatchers had a solid quarter, but if we look at the bigger picture, is this stock a buy? The latest quarter does matter, but not nearly as much as longer-term fundamentals and valuation, when deciding if the stock is a buy. We cover that in our actionable full research report which you can read here, it’s free for active Edge members.