Outdoor lifestyle products brand (NYSE: YETI) reported Q3 CY2025 results beating Wall Street’s revenue expectations, with sales up 1.9% year on year to $487.8 million. Its non-GAAP profit of $0.61 per share was 4.5% above analysts’ consensus estimates.
Is now the time to buy YETI? Find out by accessing our full research report, it’s free for active Edge members.
YETI (YETI) Q3 CY2025 Highlights:
- Revenue: $487.8 million vs analyst estimates of $480.2 million (1.9% year-on-year growth, 1.6% beat)
- Adjusted EPS: $0.61 vs analyst estimates of $0.58 (4.5% beat)
- Adjusted EBITDA: $68.15 million vs analyst estimates of $76.57 million (14% margin, 11% miss)
- Management raised its full-year Adjusted EPS guidance to $2.44 at the midpoint, a 1% increase
- Operating Margin: 11.1%, down from 14.6% in the same quarter last year
- Free Cash Flow Margin: 18.3%, up from 15.4% in the same quarter last year
- Market Capitalization: $2.71 billion
Matt Reintjes, President and Chief Executive Officer, commented, “Our third quarter results continue to show the strength of YETI and the positive momentum of our long-term growth strategy. Anchored in accelerating product innovation, a powerful and growing global brand, and expanding international reach, we are seeing meaningful wins across all three strategic growth pillars. As we look beyond 2025, continued execution against these three pillars sets YETI on the path to a long-term topline growth range of high-single-digits to low-double-digits.
Company Overview
Founded by two brothers from Texas, YETI (NYSE: YETI) specializes in durable outdoor goods including coolers, drinkware, and other gear tailored to adventure enthusiasts.
Revenue Growth
Reviewing a company’s long-term sales performance reveals insights into its quality. Any business can have short-term success, but a top-tier one grows for years. Over the last five years, YETI grew its sales at a 12.6% annual rate. Although this growth is acceptable on an absolute basis, it fell short of our standards for the consumer discretionary sector, which enjoys a number of secular tailwinds.
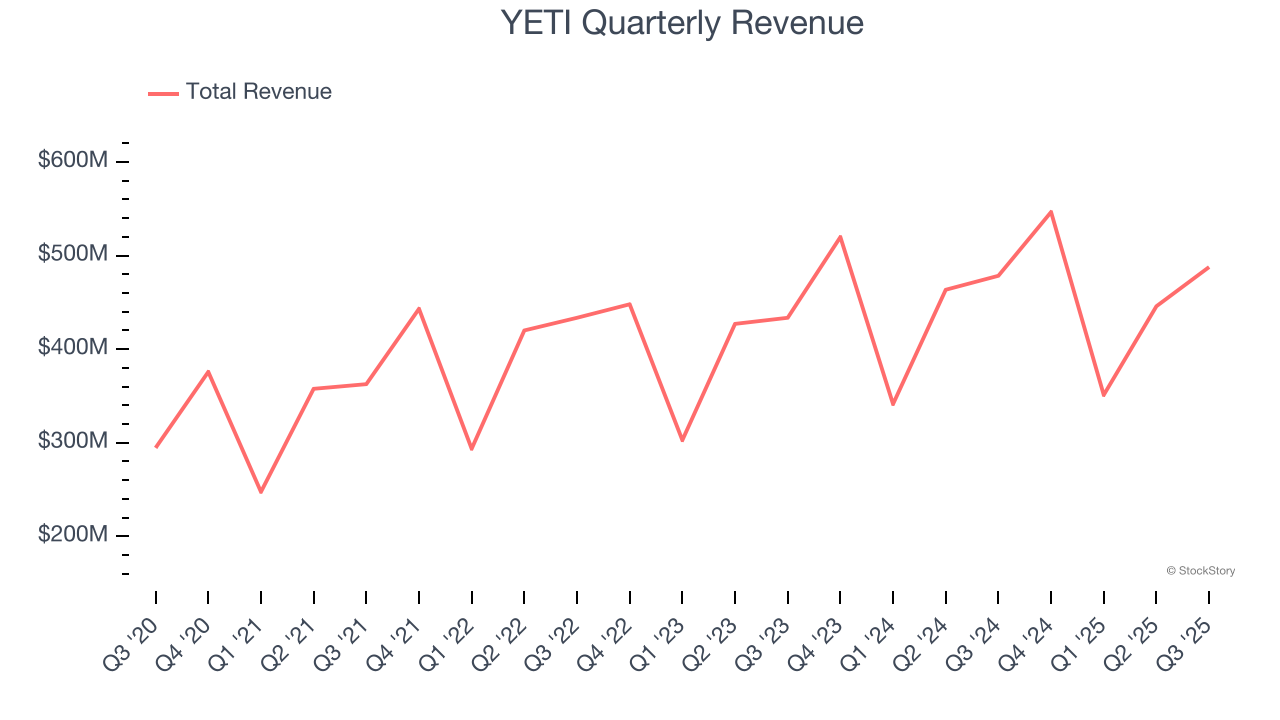
We at StockStory place the most emphasis on long-term growth, but within consumer discretionary, a stretched historical view may miss a company riding a successful new product or trend. YETI’s recent performance shows its demand has slowed as its annualized revenue growth of 6.6% over the last two years was below its five-year trend. 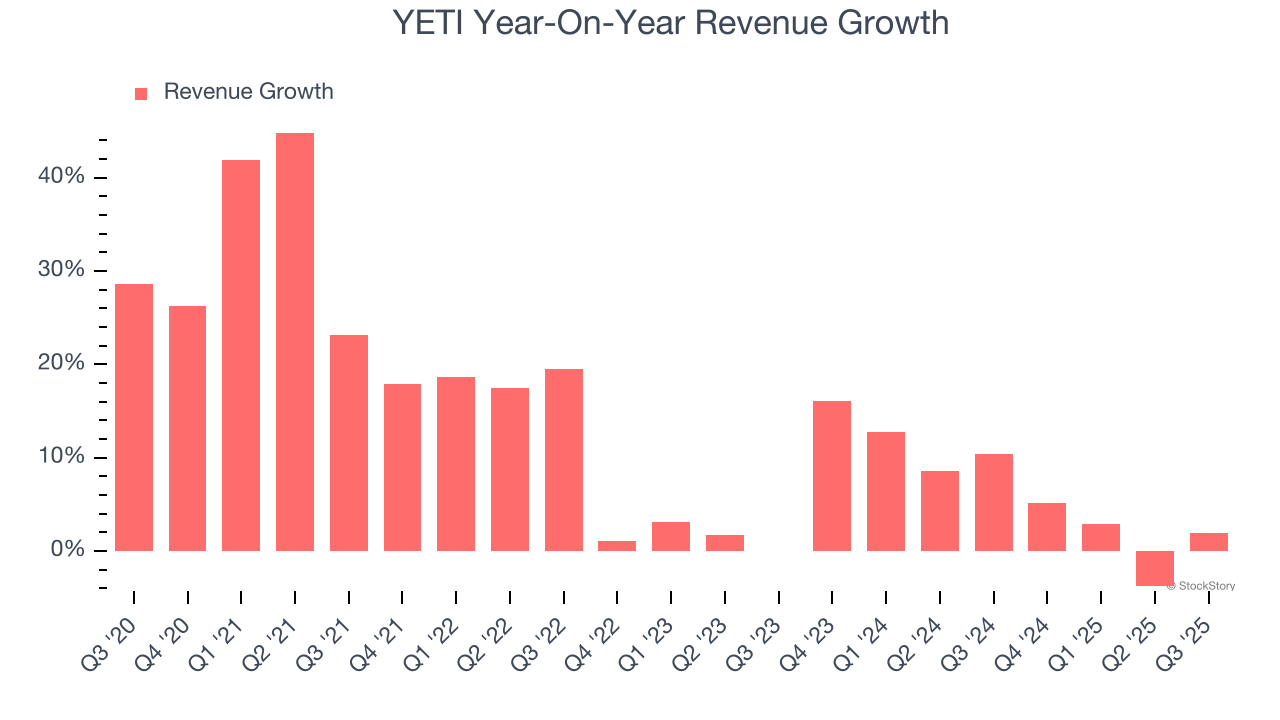
We can dig further into the company’s revenue dynamics by analyzing its most important segments, Retail and Wholesale, which are 59.2% and 40.8% of revenue. Over the last two years, YETI’s Retail revenue (direct sales to customers) averaged 2.2% year-on-year growth. On the other hand, its Wholesale revenue (sales to retailers) averaged 1.9% declines. 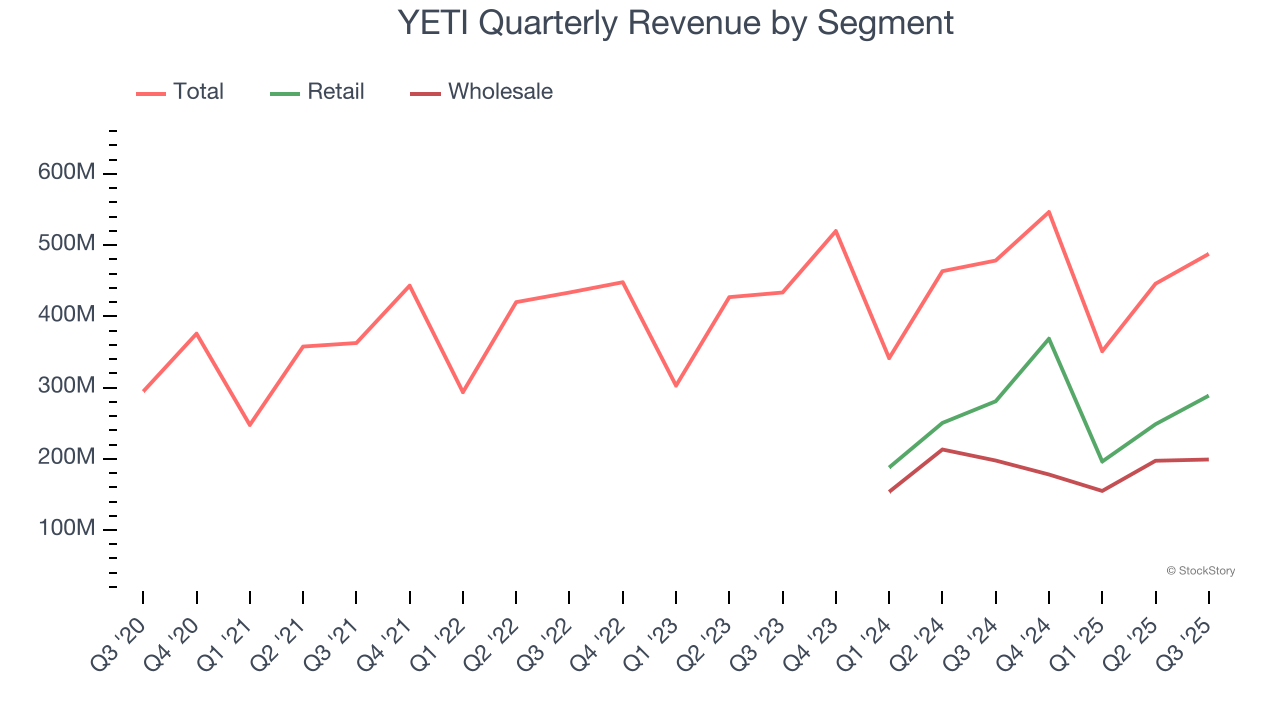
This quarter, YETI reported modest year-on-year revenue growth of 1.9% but beat Wall Street’s estimates by 1.6%.
Looking ahead, sell-side analysts expect revenue to grow 5% over the next 12 months, a slight deceleration versus the last two years. This projection doesn't excite us and suggests its products and services will face some demand challenges.
Microsoft, Alphabet, Coca-Cola, Monster Beverage—all began as under-the-radar growth stories riding a massive trend. We’ve identified the next one: a profitable AI semiconductor play Wall Street is still overlooking. Go here for access to our full report.
Operating Margin
YETI’s operating margin has been trending down over the last 12 months, but it still averaged 13.3% over the last two years, solid for a consumer discretionary business. This shows it generally manages its expenses well.
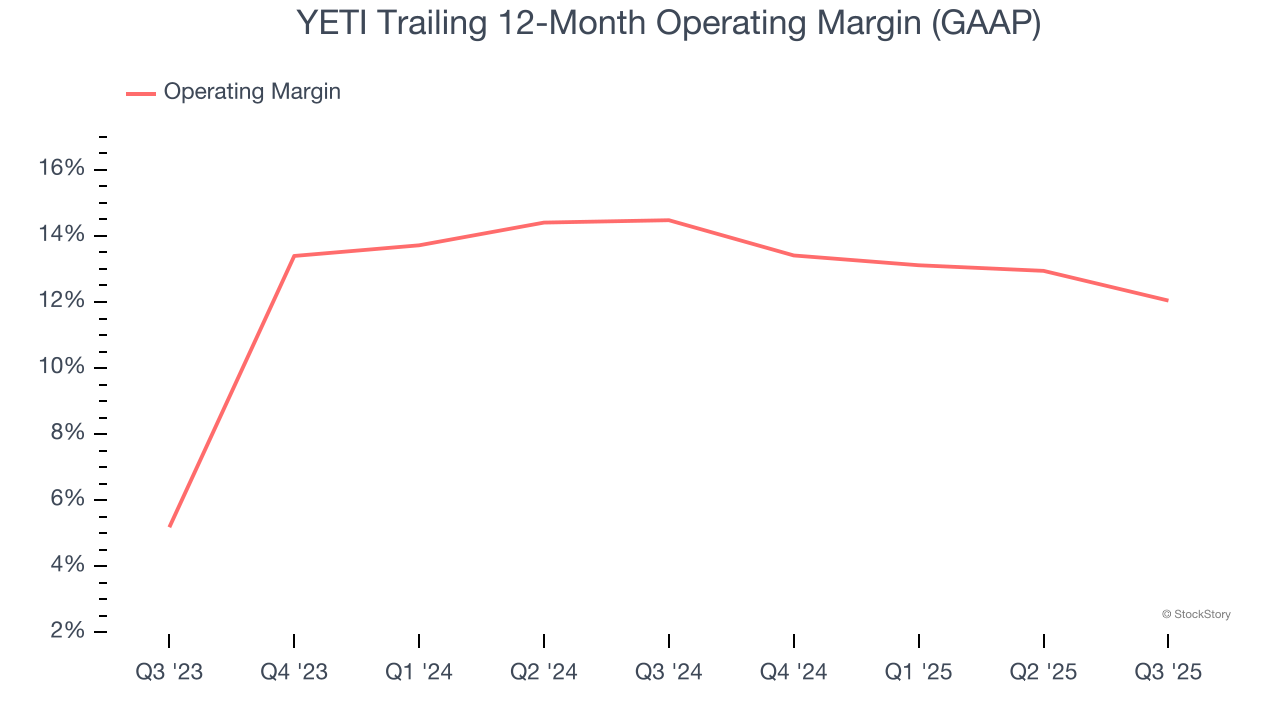
This quarter, YETI generated an operating margin profit margin of 11.1%, down 3.4 percentage points year on year. This contraction shows it was less efficient because its expenses grew faster than its revenue.
Earnings Per Share
Revenue trends explain a company’s historical growth, but the long-term change in earnings per share (EPS) points to the profitability of that growth – for example, a company could inflate its sales through excessive spending on advertising and promotions.
YETI’s EPS grew at an unimpressive 9.9% compounded annual growth rate over the last five years, lower than its 12.6% annualized revenue growth. This tells us the company became less profitable on a per-share basis as it expanded due to non-fundamental factors such as interest expenses and taxes.

In Q3, YETI reported adjusted EPS of $0.61, down from $0.71 in the same quarter last year. Despite falling year on year, this print beat analysts’ estimates by 4.5%. Over the next 12 months, Wall Street expects YETI’s full-year EPS of $2.58 to grow 1.3%.
Key Takeaways from YETI’s Q3 Results
It was encouraging to see YETI beat analysts’ revenue expectations this quarter. We were also glad its EPS outperformed Wall Street’s estimates. On the other hand, its EBITDA missed. Zooming out, we think this was a mixed quarter. The stock remained flat at $33.39 immediately after reporting.
Is YETI an attractive investment opportunity right now? When making that decision, it’s important to consider its valuation, business qualities, as well as what has happened in the latest quarter. We cover that in our actionable full research report which you can read here, it’s free for active Edge members.