Since November 2020, the S&P 500 has delivered a total return of 89.1%. But one standout stock has nearly doubled the market - over the past five years, Red Rock Resorts has surged 162% to $57.01 per share. Its momentum hasn’t stopped as it’s also gained 29.6% in the last six months, beating the S&P by 10.1%.
Is now the time to buy Red Rock Resorts, or should you be careful about including it in your portfolio? See what our analysts have to say in our full research report, it’s free for active Edge members.
Why Is Red Rock Resorts Not Exciting?
Despite the momentum, we're swiping left on Red Rock Resorts for now. Here are two reasons there are better opportunities than RRR and a stock we'd rather own.
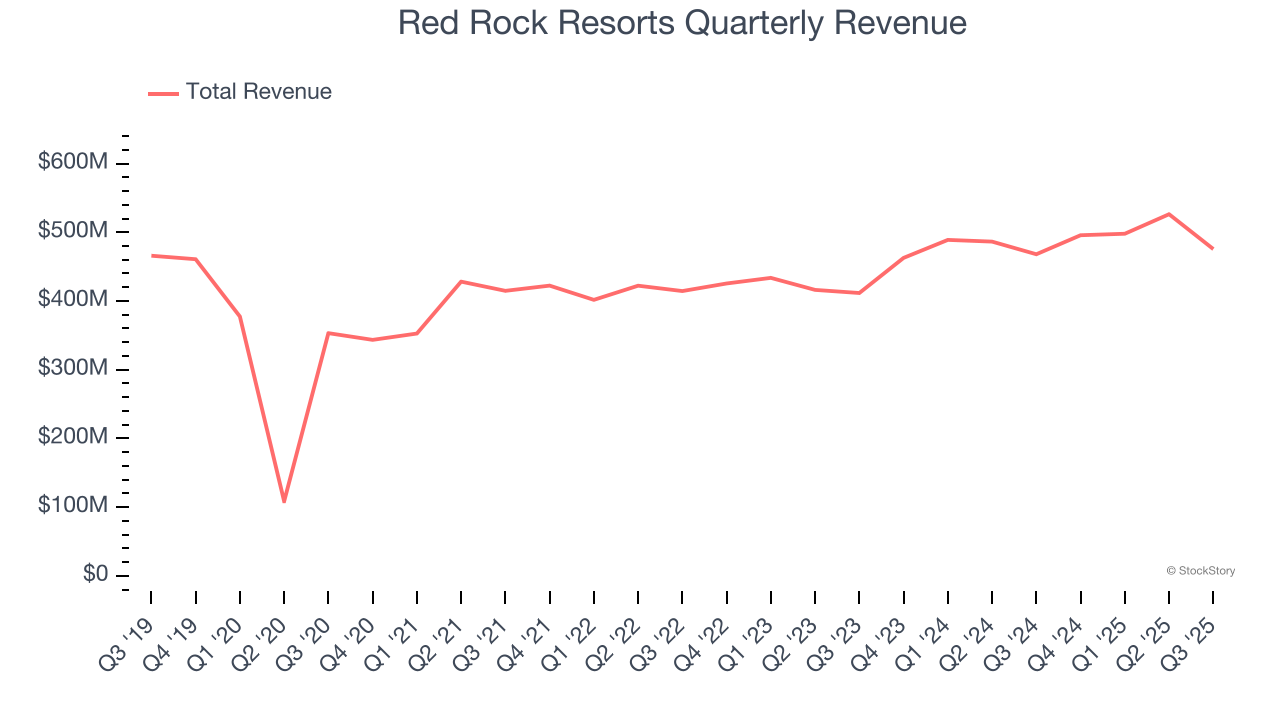
1. Long-Term Revenue Growth Disappoints
Examining a company’s long-term performance can provide clues about its quality. Any business can put up a good quarter or two, but many enduring ones grow for years. Unfortunately, Red Rock Resorts’s 9% annualized revenue growth over the last five years was sluggish. This was below our standard for the consumer discretionary sector.
2. Projected Revenue Growth Is Slim
Forecasted revenues by Wall Street analysts signal a company’s potential. Predictions may not always be accurate, but accelerating growth typically boosts valuation multiples and stock prices while slowing growth does the opposite.
Over the next 12 months, sell-side analysts expect Red Rock Resorts’s revenue to rise by 2%, a deceleration versus its 9% annualized growth for the past five years. This projection is underwhelming and indicates its products and services will face some demand challenges.
Final Judgment
Red Rock Resorts’s business quality ultimately falls short of our standards. With its shares outperforming the market lately, the stock trades at 28.5× forward P/E (or $57.01 per share). This valuation is reasonable, but the company’s shakier fundamentals present too much downside risk. We're fairly confident there are better investments elsewhere. We’d recommend looking at a top digital advertising platform riding the creator economy.
High-Quality Stocks for All Market Conditions
Trump’s April 2025 tariff bombshell triggered a massive market selloff, but stocks have since staged an impressive recovery, leaving those who panic sold on the sidelines.
Take advantage of the rebound by checking out our Top 6 Stocks for this week. This is a curated list of our High Quality stocks that have generated a market-beating return of 183% over the last five years (as of March 31st 2025).
Stocks that made our list in 2020 include now familiar names such as Nvidia (+1,545% between March 2020 and March 2025) as well as under-the-radar businesses like the once-micro-cap company Kadant (+351% five-year return). Find your next big winner with StockStory today.
StockStory is growing and hiring equity analyst and marketing roles. Are you a 0 to 1 builder passionate about the markets and AI? See the open roles here.