
Bank of Hawaii currently trades at $64.65 per share and has shown little upside over the past six months, posting a small loss of 3.4%. The stock also fell short of the S&P 500’s 19.5% gain during that period.
Is now the time to buy Bank of Hawaii, or should you be careful about including it in your portfolio? Get the full breakdown from our expert analysts, it’s free for active Edge members.
Why Is Bank of Hawaii Not Exciting?
We're cautious about Bank of Hawaii. Here are three reasons we avoid BOH and a stock we'd rather own.
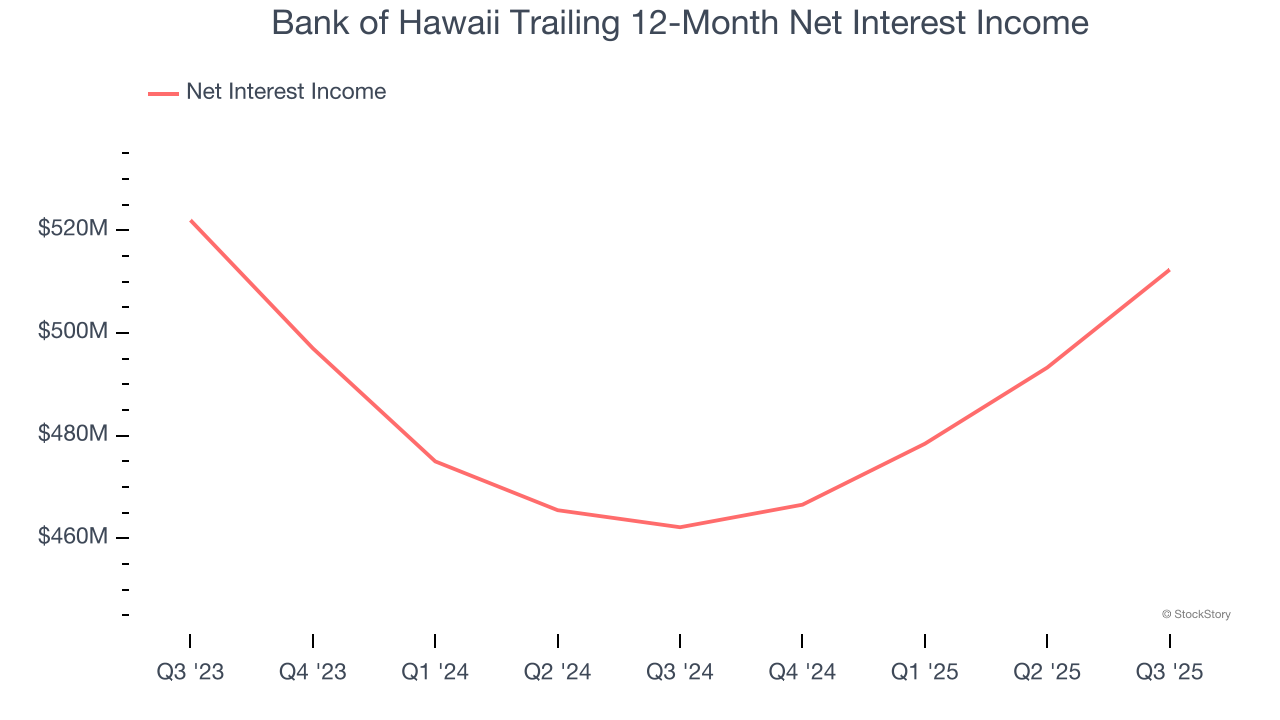
1. Net Interest Income Hits a Plateau
Net interest income commands greater market attention due to its reliability and consistency, whereas one-time fees are often seen as lower-quality revenue that lacks the same dependable characteristics.
Bank of Hawaii’s net interest income was flat over the last five years, much worse than the broader banking industry and in line with its total revenue. This was driven by an increasing loan book and falling net interest margin, which represents how much a bank earns in relation to its outstanding loans.
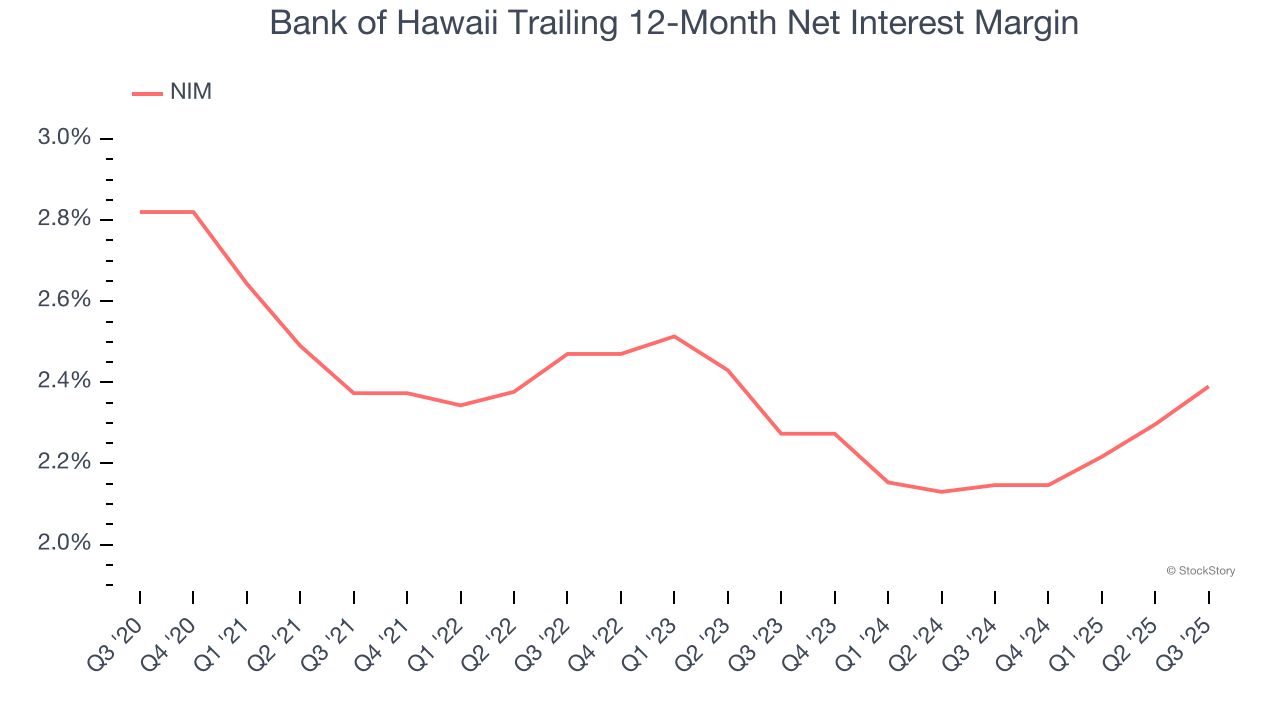
2. Low Net Interest Margin Reveals Weak Loan Book Profitability
Net interest margin (NIM) represents the unit economics of a bank by measuring the profitability of its interest-bearing assets relative to its interest-bearing liabilities. It's a fundamental metric that investors use to assess lending premiums and returns.
Over the past two years, we can see that Bank of Hawaii’s net interest margin averaged a poor 2.3%. This metric is well below other banks, signaling its loans aren’t very profitable.
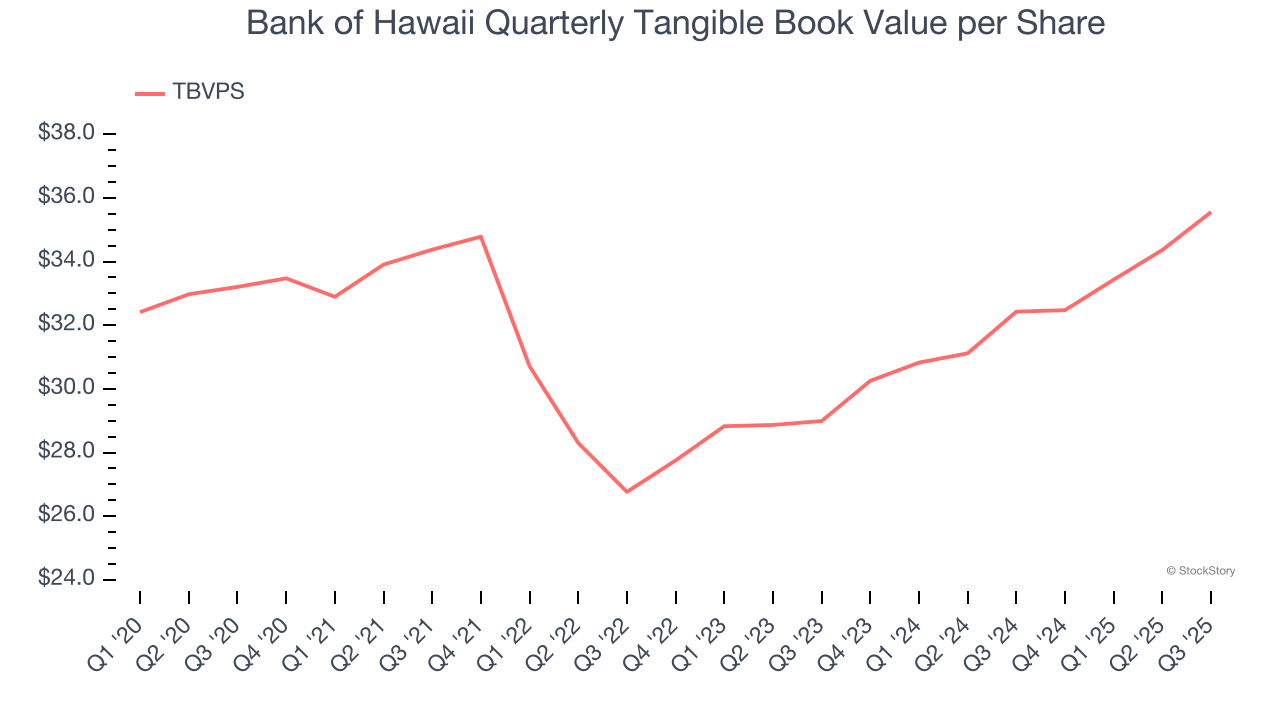
3. TBVPS Growth Demonstrates Strong Asset Foundation
In the banking industry, tangible book value per share (TBVPS) provides the clearest picture of shareholder value, as it focuses on concrete assets while excluding intangible items that may not hold value during challenging times.
Although Bank of Hawaii’s TBVPS increased by a meager 1.4% annually over the last five years, the good news is that its growth has recently accelerated as TBVPS grew at a decent 10.7% annual clip over the past two years (from $28.99 to $35.56 per share).
Final Judgment
Bank of Hawaii isn’t a terrible business, but it doesn’t pass our quality test. With its shares trailing the market in recent months, the stock trades at 1.7× forward P/B (or $64.65 per share). This valuation tells us it’s a bit of a market darling with a lot of good news priced in - you can find more timely opportunities elsewhere. Let us point you toward a safe-and-steady industrials business benefiting from an upgrade cycle.
Stocks We Would Buy Instead of Bank of Hawaii
Fresh US-China trade tensions just tanked stocks—but strong bank earnings are fueling a sharp rebound. Don’t miss the bounce.
Don’t let fear keep you from great opportunities and take a look at Top 5 Growth Stocks for this month. This is a curated list of our High Quality stocks that have generated a market-beating return of 183% over the last five years (as of March 31st 2025).
Stocks that made our list in 2020 include now familiar names such as Nvidia (+1,545% between March 2020 and March 2025) as well as under-the-radar businesses like the once-micro-cap company Kadant (+351% five-year return). Find your next big winner with StockStory today.
StockStory is growing and hiring equity analyst and marketing roles. Are you a 0 to 1 builder passionate about the markets and AI? See the open roles here.