Over the last six months, VeriSign’s shares have sunk to $240.20, producing a disappointing 16.4% loss - a stark contrast to the S&P 500’s 19.5% gain. This may have investors wondering how to approach the situation.
Is now the time to buy VeriSign, or should you be careful about including it in your portfolio? Dive into our full research report to see our analyst team’s opinion, it’s free for active Edge members.
Why Is VeriSign Not Exciting?
Even though the stock has become cheaper, we're swiping left on VeriSign for now. Here are three reasons you should be careful with VRSN and a stock we'd rather own.
1. Long-Term Revenue Growth Disappoints
A company’s long-term sales performance can indicate its overall quality. Any business can experience short-term success, but top-performing ones enjoy sustained growth for years. Over the last five years, VeriSign grew its sales at a weak 5.3% compounded annual growth rate. This fell short of our benchmark for the software sector.

2. Projected Revenue Growth Is Slim
Forecasted revenues by Wall Street analysts signal a company’s potential. Predictions may not always be accurate, but accelerating growth typically boosts valuation multiples and stock prices while slowing growth does the opposite.
Over the next 12 months, sell-side analysts expect VeriSign’s revenue to rise by 4.9%, close to its 5.3% annualized growth for the past five years. This projection doesn't excite us and implies its newer products and services will not accelerate its top-line performance yet.
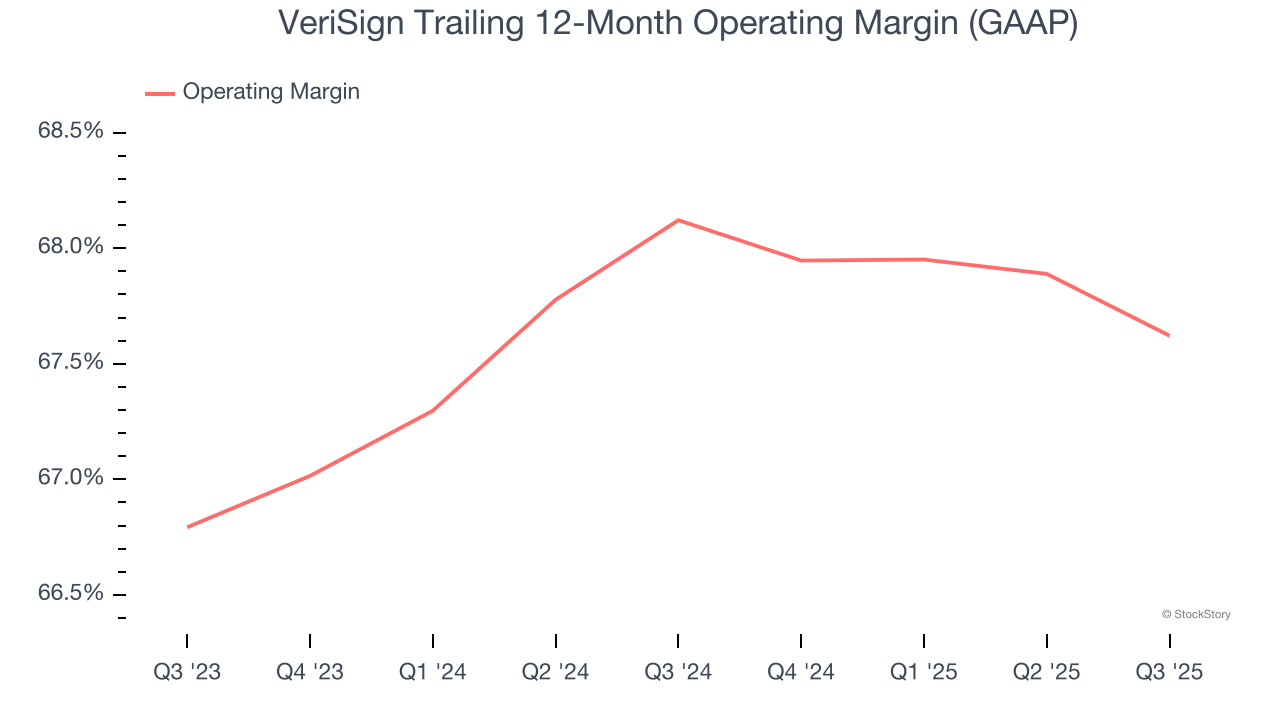
3. Operating Margin in Limbo
Many software businesses adjust their profits for stock-based compensation (SBC), but we prioritize GAAP operating margin because SBC is a real expense used to attract and retain engineering and sales talent. This metric shows how much revenue remains after accounting for all core expenses – everything from the cost of goods sold to sales and R&D.
Analyzing the trend in its profitability, VeriSign’s operating margin might fluctuated slightly but has generally stayed the same over the last two years. This raises questions about the company’s expense base because its revenue growth should have given it leverage on its fixed costs, resulting in better economies of scale and profitability. Its operating margin for the trailing 12 months was 67.6%.
Final Judgment
VeriSign’s business quality ultimately falls short of our standards. Following the recent decline, the stock trades at 13.2× forward price-to-sales (or $240.20 per share). At this valuation, there’s a lot of good news priced in - we think there are better opportunities elsewhere. We’d recommend looking at our favorite semiconductor picks and shovels play.
High-Quality Stocks for All Market Conditions
Donald Trump’s April 2025 "Liberation Day" tariffs sent markets into a tailspin, but stocks have since rebounded strongly, proving that knee-jerk reactions often create the best buying opportunities.
The smart money is already positioning for the next leg up. Don’t miss out on the recovery - check out our Top 5 Strong Momentum Stocks for this week. This is a curated list of our High Quality stocks that have generated a market-beating return of 183% over the last five years (as of March 31st 2025).
Stocks that made our list in 2020 include now familiar names such as Nvidia (+1,545% between March 2020 and March 2025) as well as under-the-radar businesses like the once-small-cap company Exlservice (+354% five-year return). Find your next big winner with StockStory today.
StockStory is growing and hiring equity analyst and marketing roles. Are you a 0 to 1 builder passionate about the markets and AI? See the open roles here.