
Over the last six months, Amdocs’s shares have sunk to $77.15, producing a disappointing 17.3% loss - a stark contrast to the S&P 500’s 13.4% gain. This may have investors wondering how to approach the situation.
Is now the time to buy Amdocs, or should you be careful about including it in your portfolio? Get the full stock story straight from our expert analysts, it’s free for active Edge members.
Why Do We Think Amdocs Will Underperform?
Even with the cheaper entry price, we don't have much confidence in Amdocs. Here are three reasons why DOX doesn't excite us and a stock we'd rather own.
1. Backlog Is Unchanged, Sales Pipeline Stalls
In addition to reported revenue, backlog is a useful data point for analyzing Enterprise Networking companies. This metric shows the value of outstanding orders that have not yet been executed or delivered, giving visibility into Amdocs’s future revenue streams.
Over the last two years, Amdocs failed to grow its backlog, which came in at $4.19 billion in the latest quarter. This performance was underwhelming and shows the company faced challenges in winning new orders. It also suggests there may be increasing competition or market saturation. 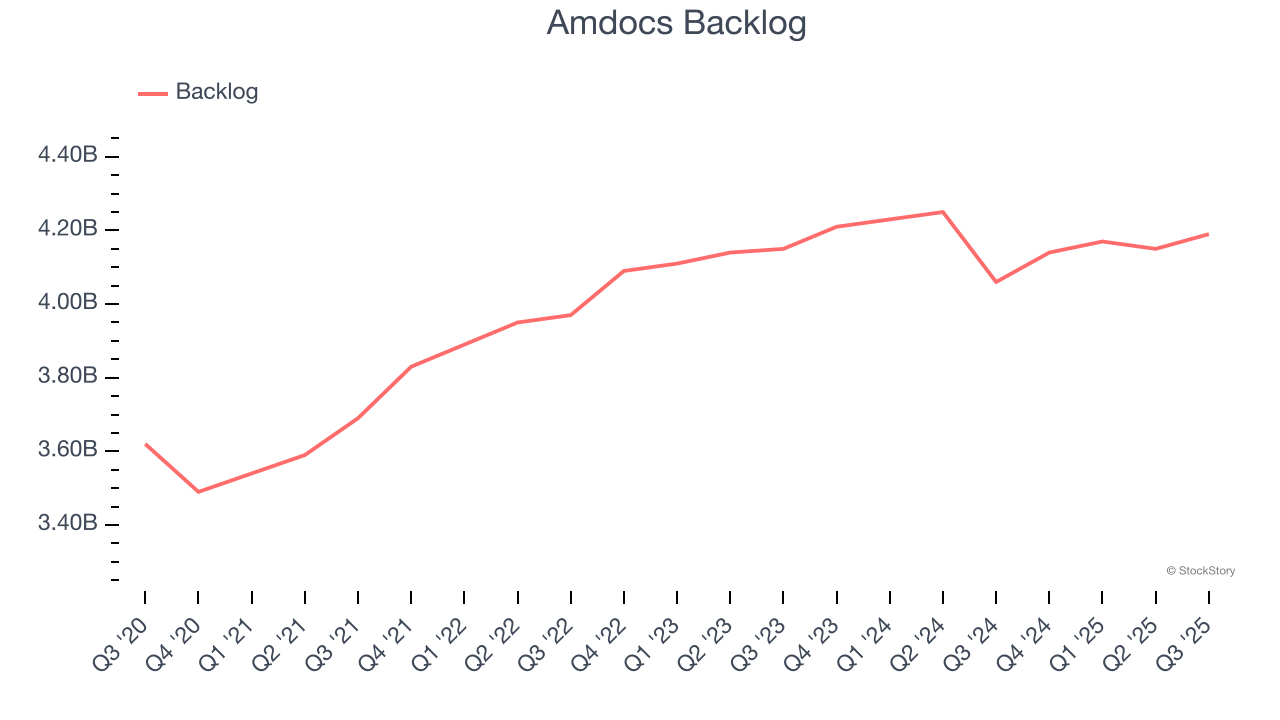
2. Projected Revenue Growth Is Slim
Forecasted revenues by Wall Street analysts signal a company’s potential. Predictions may not always be accurate, but accelerating growth typically boosts valuation multiples and stock prices while slowing growth does the opposite.
Over the next 12 months, sell-side analysts expect Amdocs’s revenue to rise by 3.3%. Although this projection indicates its newer products and services will fuel better top-line performance, it is still below average for the sector.
3. Free Cash Flow Margin Dropping
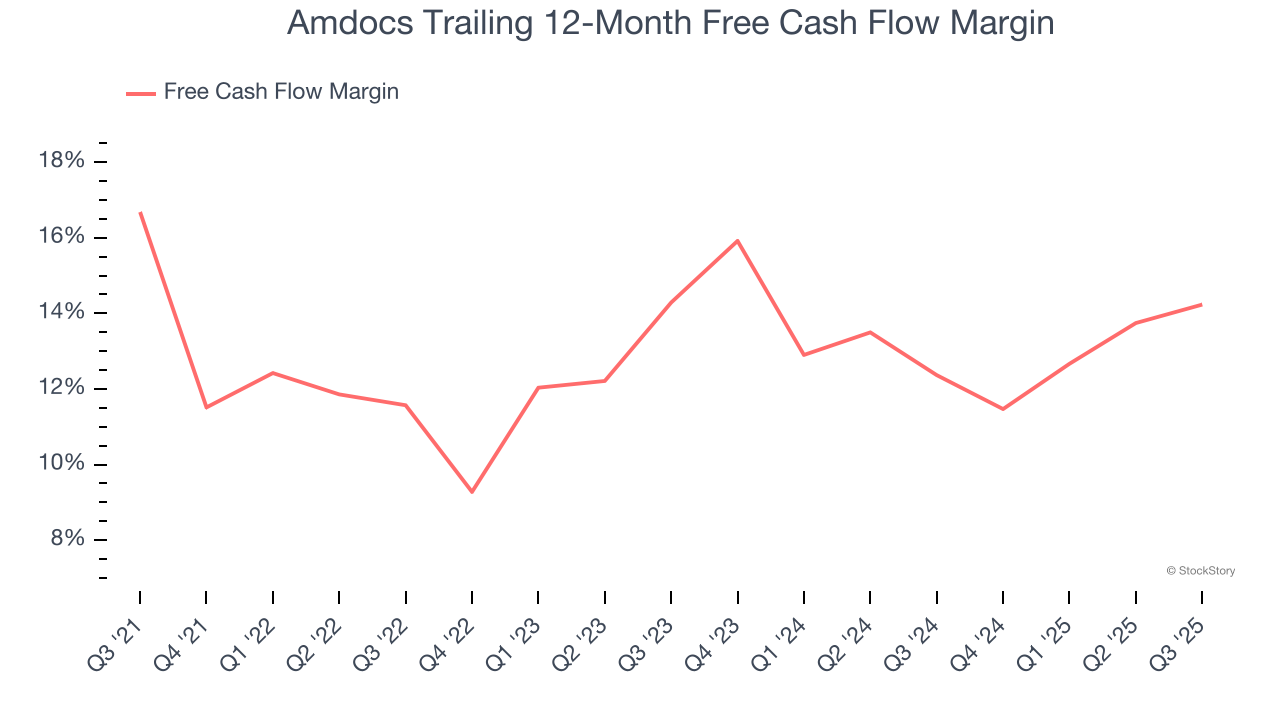
Free cash flow isn't a prominently featured metric in company financials and earnings releases, but we think it's telling because it accounts for all operating and capital expenses, making it tough to manipulate. Cash is king.
As you can see below, Amdocs’s margin dropped by 2.4 percentage points over the last five years. If its declines continue, it could signal increasing investment needs and capital intensity. Amdocs’s free cash flow margin for the trailing 12 months was 14.2%.
Final Judgment
Amdocs doesn’t pass our quality test. After the recent drawdown, the stock trades at 10.3× forward P/E (or $77.15 per share). This valuation tells us a lot of optimism is priced in - we think other companies feature superior fundamentals at the moment. We’d suggest looking at a fast-growing restaurant franchise with an A+ ranch dressing sauce.
Stocks We Like More Than Amdocs
The market’s up big this year - but there’s a catch. Just 4 stocks account for half the S&P 500’s entire gain. That kind of concentration makes investors nervous, and for good reason. While everyone piles into the same crowded names, smart investors are hunting quality where no one’s looking - and paying a fraction of the price. Check out the high-quality names we’ve flagged in our Top 9 Market-Beating Stocks. This is a curated list of our High Quality stocks that have generated a market-beating return of 244% over the last five years (as of June 30, 2025).
Stocks that have made our list include now familiar names such as Nvidia (+1,326% between June 2020 and June 2025) as well as under-the-radar businesses like the once-small-cap company Comfort Systems (+782% five-year return). Find your next big winner with StockStory today.
StockStory is growing and hiring equity analyst and marketing roles. Are you a 0 to 1 builder passionate about the markets and AI? See the open roles here.


